

Research Center


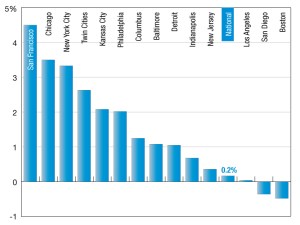
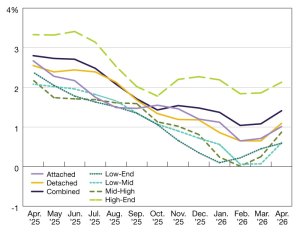
National Student Housing Report – June 2026
Preleasing remained ahead of last year’s pace in May, but new supply and slowing rent growth continued to pressure some markets, Yardi Matrix data shows.
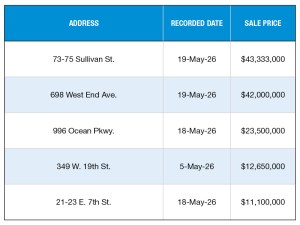
Top 5 NYC Multifamily Building Sales—May 2026
These are the top five largest transactions in New York City, according to PropertyShark.
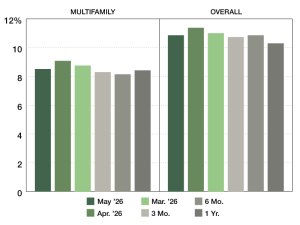
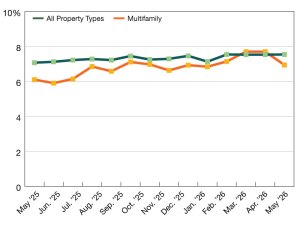

Self Storage National Report – June 2026
The latest data about the sector’s performance across 30 top markets.
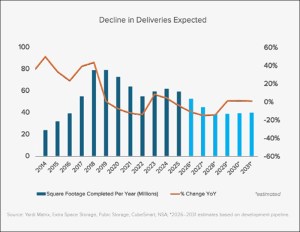
Institutional Investors Stay Focused on Self Storage Despite Challenges
Even though occupancy is dropping and deliveries are declining, the sector is still attracting significant investor interest.
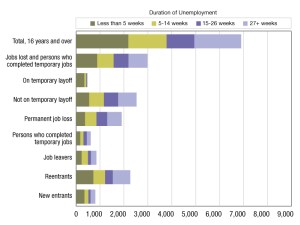
2026 Employment Update
The Bureau of Labor Statistics’ latest monthly report on how long unemployed workers are staying jobless.