Multifamily Stabilizes as the K-Shaped Recovery Takes Hold
Alongside improving national fundamentals, a sharper divide is emerging between segments.
Source: Moody’s Analytics
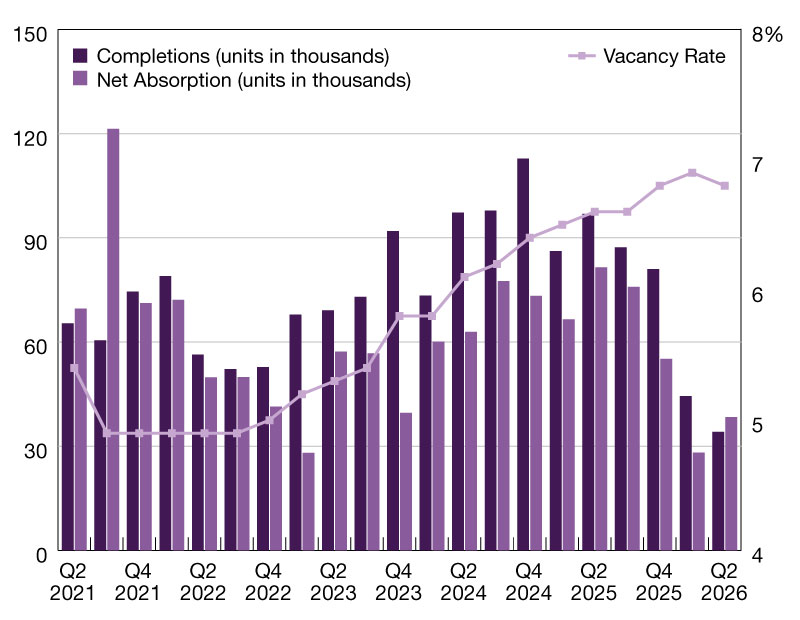
The U.S. multifamily market reached a potential inflection point in the second quarter as the supply surge that weighed on performance for several years began to recede. The national vacancy rate retreated 10 basis points to 6.8 percent, marking its first quarterly decline since 2021.
Demand also outpaced completions for the first time in more than four years, with approximately 39,000 units absorbed against more than 34,000 delivered. At the peak of the construction cycle in late 2024, completions reached more than 112,000 units. Rent growth held positive, with asking rents rising 0.7 percent overall and effective rents posting a second consecutive gain, up 0.8 percent.
READ ALSO: Why New Working-Class Rentals Are a Rare Sight
Rent gains spread across 70 of 79 markets on a quarterly basis, with 41 recording vacancy declines, nearly four times the prior quarter’s count of 11. Even in Austin, home to the highest vacancy rate among major U.S. rental markets at 10.6 percent, vacancy fell by about 170 basis points over the past year, signaling an improving supply-demand balance even in the most oversupplied market.
In contrast, the Bay Area tightened as absorption rose, with high-income renters driving Class A occupancy higher as technology-sector employment expanded. San Francisco posted a market-wide year-over-year rent gain of 6.8 percent, the highest nationally, followed by San Jose at 4.3 percent. Vacancy is also tight across major coastal markets, with Central New Jersey, Rochester, and New York registering rates below 3.5 percent, among the lowest in the country.
Despite improving national fundamentals, a sharper divide is emerging between segments. Higher-end Class A assets are benefiting from stronger renter demand and a shrinking construction pipeline, while Class BC faces growing affordability constraints that are limiting rent growth.
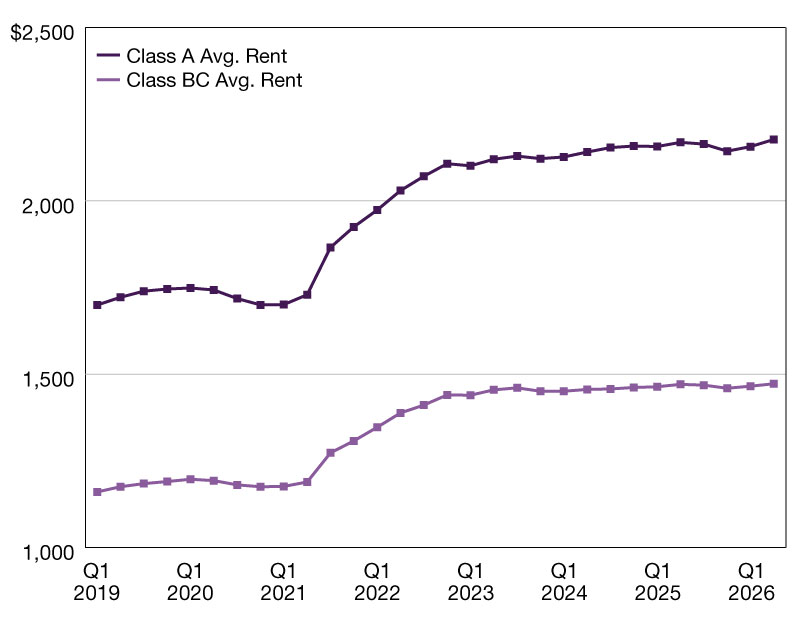
Class A and Class BC are moving in opposite directions, creating a K-shaped divergence in which Class A gains ground as Class BC stalls. Class A occupied stock grew 2.6 percent over the past year. In the second quarter, vacancy fell by 14 basis points, and asking rents rose by 0.6 percent.
Class BC, by contrast, saw occupied stock grow just 0.4 percent year-over-year, with the vacancy rate holding flat and rents gaining 0.3 percent. The rent premium separating the two classes widened to $705 in the second quarter from $691 in the first quarter, suggesting the segments are shaped by different forces rather than moving at different speeds along the same path.
Performance gains in the Class A segment cluster in markets with high concentrations of professional employment. In the second quarter, San Francisco posted the strongest Class A rent growth nationally at 3.0 percent, while San Jose, Oakland-East Bay, Seattle and Detroit each recorded gains between 2.2 percent and 2.6 percent. These markets share a combination of strong professional employment, rising high-income renter activity, and a limited construction pipeline. In the Bay Area and Seattle, technology-driven momentum has been a key driver, while other markets have benefitted from similarly favorable demand and supply dynamics.
Class BC performance across the Sun Belt
Class BC’s more measured performance reflects a structural affordability ceiling rather than a shortfall in demand. Household income constraints leave Class BC landlords with limited room to raise rents beyond what tenants can afford, even where occupancy is stable. The pressure shows most clearly in Sun Belt markets, where elevated supply and renter cost burdens reinforce each other. Tucson posted the sharpest Class BC rent contraction in the quarter at 3.7 percent. Over the past year, Class BC rents there fell 6.1 percent while Class A rents rose 2.6 percent, the divergence playing out within a single market. San Antonio and Charlotte each saw BC rent declines of around 1 percent.
The widening gap between Class A and Class BC performance will be one of the most important trends to watch through the remainder of 2026. As new supply recedes, markets with strong professional employment are positioned for further Class A rent growth.
Meanwhile, workforce-oriented properties will remain tied more closely to household affordability, leaving many operators focused on occupancy retention rather than pricing power. Whether the broader recovery broadens beyond the Class A segment will increasingly depend on how Class BC performance in the Sun Belt markets evolves and whether income growth can close the gap that supply alone has widened.
—Posted on July 23, 2026