2026 Senior Housing Market Update
Check out our report on the latest market fundamentals.
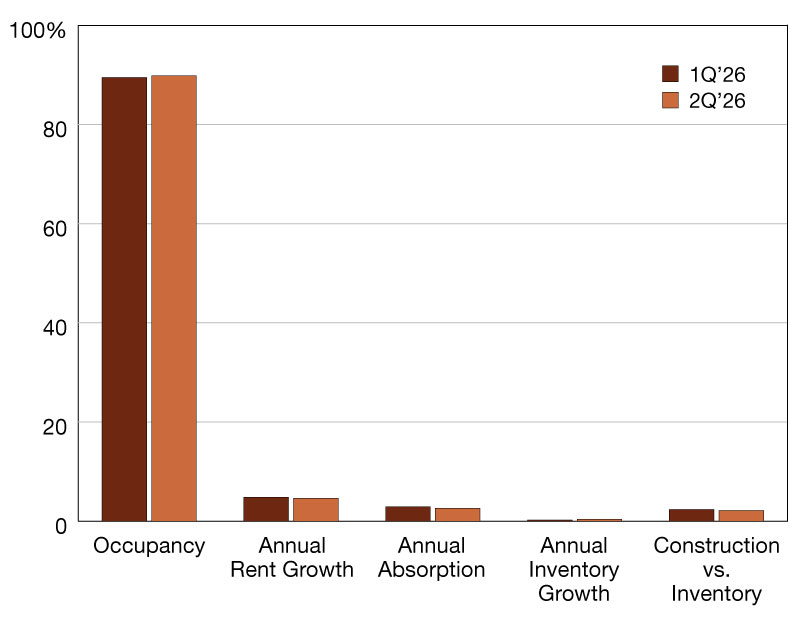
The senior housing sector occupancy improved for the 20th consecutive quarter to 89.9 percent in the second quarter of 2026. Occupancy has increased by approximately 200 basis points over the last twelve months, rising from 87.9 percent in the second quarter of 2025. Stabilized occupancy reached 90.4 percent in the second quarter, continuing its run above 90 percent that began in the first quarter of 2026—the first time that threshold had been breached since late 2017.
The second quarter marks the 20th consecutive quarter in which absorption—the net change in occupied units—exceeded inventory growth—the net change in operational units—sustaining the ongoing occupancy recovery. Net absorption for the rolling four-quarter period ending in the second quarter of 2026 totaled approximately 16,254 units, reflecting an annual absorption rate of 2.6 percent against an annual inventory growth rate of 0.4 percent. While the rolling absorption figure moderated compared to the prior year period, occupancy continues to advance as demand consistently outpaces the limited new supply entering the market.
READ ALSO: Designing Senior Housing Landscapes That Residents Actually Use
Net inventory growth remains historically subdued. Approximately 1,355 net units were added to the senior housing stock in the second quarter of 2026, bringing total inventory to 711,888 units. The annual inventory growth rate of 0.4 percent remains well below levels seen in prior development cycles and reflects a sustained multi-year period of muted supply additions. At its most recent peak, the rolling four-quarter net inventory growth reached approximately 21,357 units annually in the fourth quarter of 2018. The last four quarters have added less than 3,000 units by comparison.
Construction pipeline continues to shrink
The active construction pipeline continues to shrink, though the pace of decline has moderated in recent quarters. As of the second quarter of 2026, approximately 15,546 senior housing units are under construction across primary markets, a decline of approximately 15 percent compared to the 18,243 units under construction one year ago. Construction has declined in each of the last four consecutive quarters. Construction as a share of existing inventory stands at 2.2 percent, well below the peak of nearly 49,538 units under construction in the fourth quarter of 2019.
Average asking rent for senior housing in primary markets reached $5,911 in the second quarter of 2026, reflecting a 4.6 percent annual increase compared to the prior year. Annual rent growth has remained range-bound between approximately 4.2 percent and 4.8 percent over the last several quarters, following a period of deceleration from its peak of 6.2 percent reached in the second quarter of 2023. Asking-rate growth appears to have stabilized in the mid-4 percent range, consistent with broader market normalization following the elevated annual increases recorded in 2022–2023.
—Posted on July 24, 2026

The senior housing sector occupancy rate improved for the 19th consecutive quarter to 89.5 percent in the first quarter, a metric that has increased by 230 basis points over the last twelve months. Senior housing occupancy has increased at a consistent rate of approximately 50 basis points per quarter for more than two years now; this pace indicates that industry-wide occupancy will push past 90 percent later this year. Stabilized occupancy already broke past 90 percent occupancy in the first quarter, the first time since late 2017.
This quarter marks the 19th consecutive quarter in which absorption, the net change in occupied units, has exceeded inventory growth, the net change in operational units, which has led to continued occupancy growth across the sector. While absorption is typically lower in the first quarter, the first quarter of 2026 was up 8 percent compared to the first quarter of 2025.
Net inventory growth for senior housing has been under 1,000 units added in three of the last four quarters. The rolling four-quarter volume of net inventory growth as of the first quarter is less than 3,000 units. No period in the 20-year history of NIC MAP has this low an annual period of inventory growth occurred. At its most recent high, the rolling four-quarter net inventory growth was over 21,000 units added in the first quarter of 2020.
READ ALSO: NIC Special Report: A New Approach to Senior Housing
The gap between supply and demand will not change in the near term as active construction remains muted compared to previous development cycles. As of the first quarter, the number of senior housing units currently under construction has declined 17 straight quarters and is down 9 percent compared to the first quarter of last year.
The number of senior housing units under construction is under 16,500 currently, from a previous high nearly 50,000 units under construction in late 2019. The bottom of this development cycle is unlikely to change in the near time as construction starts for senior housing units is below 7,000 units started in primary markets over the last twelve months. This rolling four-quarter figure for construction starts has been oscillating for a number of quarters with no signs of development acceleration yet.
While senior housing occupancy is increasing, the reported annual rent change, measured against the previous year, appears to have fully stabilized in the mid 4 percent range. The average asking rent for senior housing in the first quarter exceeded $5,800. This is a 4.6 percent increase compared to the previous year. After four consecutive quarters of rate deceleration from its peak of 6.1 percent in the second quarter of 2023, annual rent change has normalized and ranged from 4.2 percent to 4.6 percent year-on-year increase over the last eight quarters.
Senior housing is poised to be one of the most profitable real estate asset classes, according to NIC MAP data in its Senior Housing Market Outlook.
—Posted on April 29, 2026