


Multifamily Fundamentals Stabilize as Market Demand Diverges
Markets supported by strong domestic migration are better positioned to maintain stability.
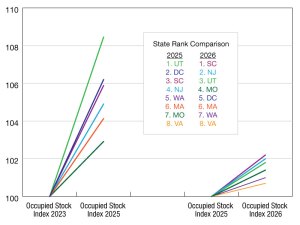
Not All Multifamily Slowdowns Are Created Equal
Which markets are coming out on top in this new investment cycle?
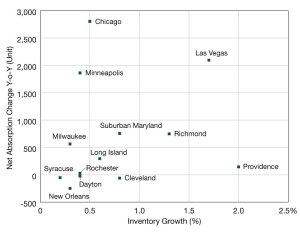
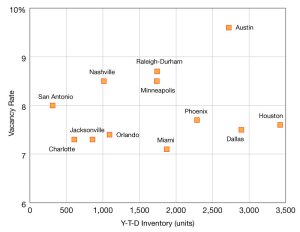
Multifamily Market Realigns as Regions Diverge
This stability masks significant underlying shifts in regional performance and supply-side dynamics.
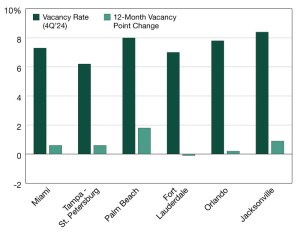
Supply Shock and Vacancy Trends in the Multifamily Market
Supply has been tapering since the beginning of the year.

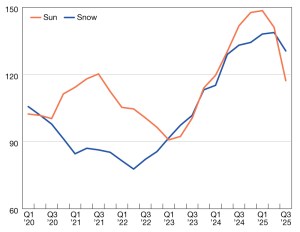
The Multifamily Market 5 Years After the Pandemic
Find out which markets had the highest cumulative rent growth between 2020 and 2025.
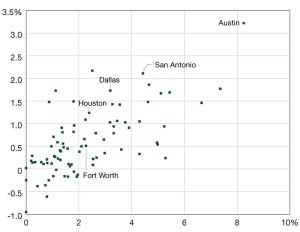
Moody’s Update: Population Shifts Shape Housing Demand
How migration trends influenced the multifamily market last year. Read the report.
Moody’s Update: Rising Vacancies and Revenue Pressures
Elevated vacancy rates have led to higher concessions in tenant-favored markets.