National Affordable Housing Report – February 2026
Affordable NOI growth outpaced traditional multifamily gains in 2025, according to a new Yardi Matrix report.
Fully affordable multifamily properties registered a higher net operating income growth rate compared to their traditional counterparts in 2025, according to Yardi Matrix Expert data. That marked the second year in a row when affordable communities tipped the scales in their favor.
Gross income growth for affordable properties clocked in at 5.7 percent in 2025, outperforming market-rate communities, which registered just a 2.1 percent increase, Yardi Matrix’s newest affordable housing report shows. This translated into an 8.7 percent and 2.2 percent uptick in the NOI expansion across income-restricted and traditional multifamily properties, respectively.
The reason is multifaceted, but it includes a higher gross income growth for affordable properties due to a larger allowable rent increase dictated by HUD, as well as a moderation in the overall expense growth.
On the income side, HUD’s average allowable maximum rent increased by more than 6.0 percent in 2025, with some areas even going as high as 9.2 percent. Additionally, more than 70 percent of tracts allowed a growth of at least 5.0 percent.
However, it is important to note that not all properties opted to increase rents, even if allowed to do so. Meanwhile, advertised market-rate rent growth was weak over the past few years, explaining part of the dynamic between the property types.
Affordable property expenses grew on average just 3.3 percent per unit in 2025, down from the peak of 7.8 percent in 2022 and 2023. Payroll costs were the steepest ($2,176 per unit on average in 2025, up 3.9 percent year-over-year), followed by repairs and maintenance ($1,683, up 4.2 percent). Utilities rounded up the top three ($1,519, up 4.2 percent).
One of the culprits behind the expense crests of 2022 and 2023 was insurance, which ballooned on average by 126.2 percent between 2020 and 2025 for affordable housing properties. However, these premiums began to plateau, increasing just 0.2 percent per unit last year.
NOI growth is highest in the Northeast and Southeast
The income and expense delta varied greatly by region and metro. Largest NOI growth was recorded across the Northeast and Southeast, while the Southwest registered the lowest gains.
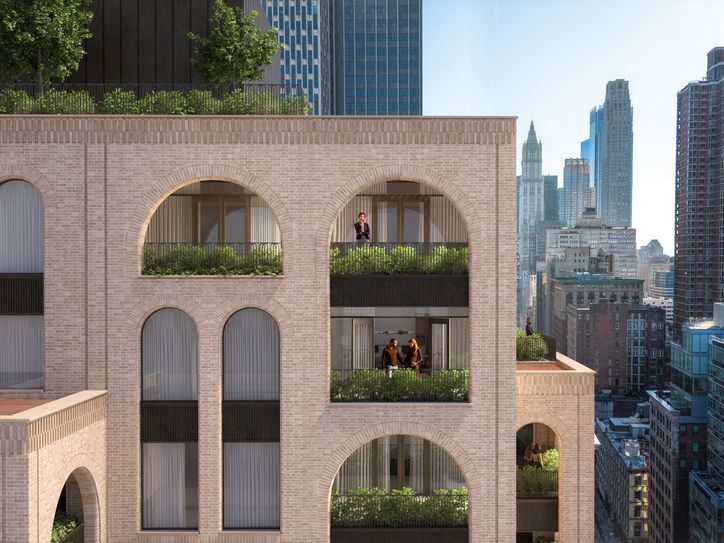
Expensive markets such as New York City, Boston or Philadelphia presented large gaps between advertised market-rate and affordable rents, resulting in a higher demand for income-restricted properties. When coupled with higher allowable HUD increases, this led to an average growth of 12.9 percent in the NOI of affordable housing properties across the Northeast.
Conversely, Southwest affordable properties struggled in supply-heavy metros where market-rate competition was fierce. The average NOI increase across the region clocked in at 2.5 percent in 2025, but there are some extreme outliers, such as Austin, Texas (-18.9 percent) and Dallas (-2.2 percent).
While the overall performance of income-restricted properties is strong, singular instances of property distress do occur. In fact, a November study from Cohn Reznick revealed that one in four LIHTC communities report operating deficits. However, diligent and efficient operators may reap the benefits of the fully affordable sector, which continues outperforming the traditional market-rate counterpart.
This imbalance between the duo is also echoed by a study from the University of Texas, which revealed that apartments marketed for tenants earning less than 80 percent of area median income outperformed assets targeting higher-income residents over a 10-year period.
Read the full Yardi Matrix affordable housing report.
Most Recent