

")
")
")
")
")
")
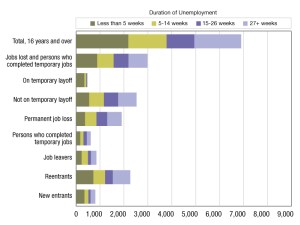
2026 Employment Update
The Bureau of Labor Statistics’ latest monthly report on how long unemployed workers are staying jobless.

National Affordable Housing Report – June 2026
A new report tracks production in 10 top markets.
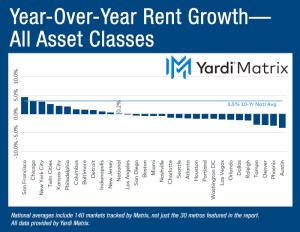
National Multifamily Report – May 2026
Annual growth turns positive following two consecutive monthly improvements, according to Yardi Matrix.

National Student Housing Report – May 2026
Preleasing remains ahead of last year’s pace, according to the latest Yardi Matrix data.


St. Louis Multifamily Report – May 2026
Fundamentals are sturdy despite heavy supply.


Philadelphia Multifamily Report – May 2026
The market is showing steady metrics despite a wave of new supply.

Twin Cities Multifamily Report – May 2026
Rates and occupancy are solid in Minneapolis–St. Paul.

San Antonio Multifamily Report – May 2026
Asking rents and occupancy are feeling the pinch.