Megaregion in the Making? Austin-San Antonio’s I-35 Corridor
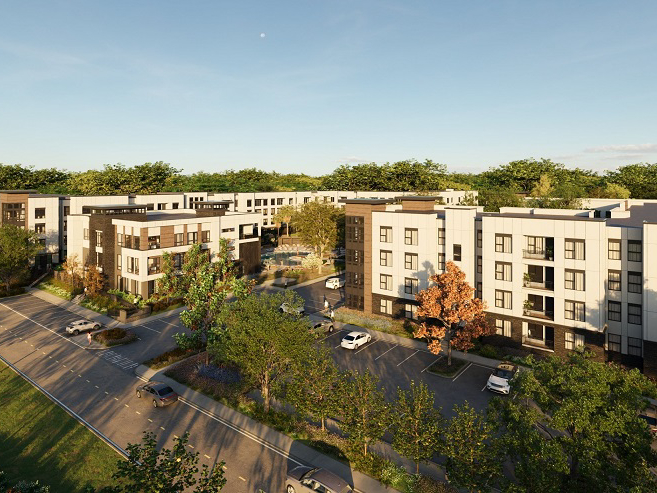
The I-35 corridor is gradually evolving into a continuous urbanized region.
The Interstate 35 corridor between Austin and San Antonio connects one of the fastest-growing megaregions in the U.S. and is one of the most vital economic arteries in the state of Texas. Although momentum has slowed overall, both Austin (1.6 percent) and San Antonio (1.8 percent), the metros at the core of this emerging area, continued to outperform national employment figures, at 0.8 percent.
As population and economic growth reshape the corridor, the central question is how well can the real estate sector sustain this continued expansion. Officials and planners in the region often point to Dallas–Fort Worth as both a model and a cautionary tale. Over several decades, DFW has transformed from two distinct urban centers into an integrated megaregion, enabled by large-scale infrastructure investment and coordinated regional planning. Austin and San Antonio could eventually take steps toward a more unified regional approach along the I-35, as the idea resurfaces in planning discussions and often draws comparisons to the neighboring Metroplex.
Drawing on delivery and under-construction pipelines, rent trends and occupancy metrics from Yardi Matrix, we assessed how supply surges and market absorption imbalances between 2020 and the halfway point of 2025 have shaped housing conditions along the I-35 corridor. The area includes Austin submarket San Marcos/Kyle and the San Antonio submarkets of New Braunfels, Selma, Schertz, Universal City and Outlying Guadalupe County. For context, we’re also looking at metro and national-level data.
Development trends
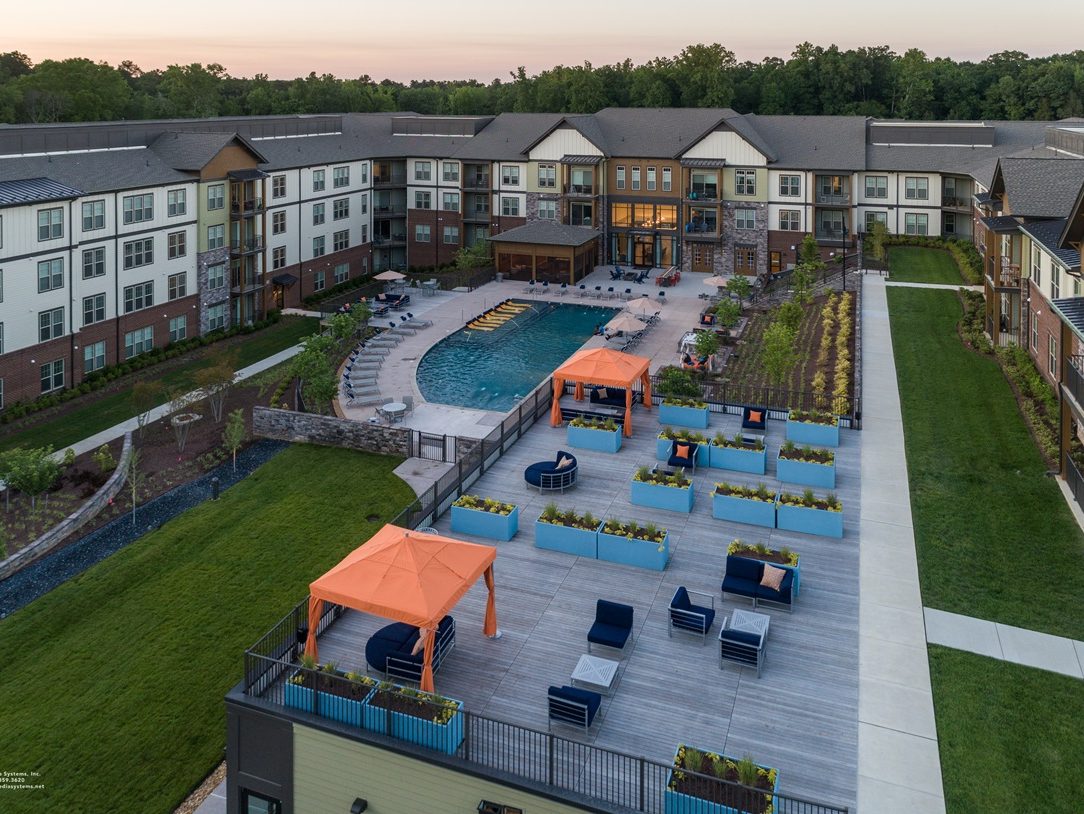
The area surrounding the I-35 corridor connecting Austin and San Antonio grew by 2,925 units in 2025 through July. The bulk, or 2,015 units, were delivered in Austin’s San Marcos/Kyle submarket, and 910 in two San Antonio submarkets—New Braunfels (622 units) and Selma (288 units). Developers maintained a strong preference for upscale Lifestyle projects. Aside from one 282-unit, Renter-by-Necessity property in New Braunfels and two fully affordable communities totaling 506 units in San Marcos/Kyle, all projects delivered so far in 2025 were Lifestyle properties.
The I-35 corridor’s construction pipeline had 4,232 units underway as of July, equivalent to 8 percent of the 52,015 units underway across both metros. Austin’s under-construction pipeline totaled 36,479 units as of July, trailing Dallas (58,691 units) but significantly outpacing San Antonio (15,536 units). Within San Antonio, corridor submarkets accounted for 12 percent of the metro’s total units under construction, while Austin’s San Marcos/Kyle submarket accounted for 7 percent of that metro’s pipeline.
READ ALSO: Top 10 US Markets for Multifamily Construction
Over the past five years, the corridor’s stock expanded by 15,388 units. San Marcos/Kyle accounted for two-thirds of this volume, or 10,275 units, while San Antonio submarkets New Braunfels (3,573 units), Selma (934 units) and Outlying Guadalupe County (606 units) combined for 5,113 units. Developers showed a strong bias toward Lifestyle product, delivering 13,644 units in this segment compared to 1,744 units in RBN and 1,538 units of fully affordable housing.
Austin’s robust housing inventory growth spans over more than a decade, totaling 110,193 units between 2020 and July 2025, more than double the 45,454 units in San Antonio. Combined, the metros added 155,647 units, a figure approaching Dallas’ inventory expansion of 162,754 units over the same period. Deliveries within the I-35 corridor accounted for 9.9 percent of Austin and San Antonio’s combined supply growth, with corridor submarkets expanding a slightly higher rate in San Antonio (11.2 percent of metro stock) than in Austin (9.3 percent).
Rent trends
As of July, average advertised asking rents in the I-35 corridor remained below the national benchmark of $1,786. Rates ranged from $1,104 in Universal City—the most affordable—to $1,598 in San Marcos/Kyle, the priciest among corridor submarkets.
In San Marcos/Kyle, average rents dropped 0.4 percent year-to-date (down $7) in 2025 through July, with negative rent movement across asset classes. Pressured by continued growth of Lifestyle stock, RBN rents dropped 1.1 percent to $1,302, while Lifestyle rents declined 0.4 percent to $1,680. Rent contraction was similar in Austin overall, where rates fell $6 to $1,632.
By contrast, San Antonio’s average increased $9 to $1,304. Only Universal City posted a decline (down $3, to $1,104), while other corridor submarkets recorded growth ranging from 1.2 percent in Selma (up $18, to $1,480) to 2.9 percent in Outlying Guadalupe County (up $36, to $1,291).
By asset class, Universal City’s Lifestyle rents posted the strongest gains, rising 7.8 percent year-to-date to $1,355, followed by Outlying Guadalupe County (up 3.0 percent to $1,307). New Braunfels posted the highest RBN average at $1,447, essentially flat year-to-date, tailed by San Marcos/Kyle (-1.1 percent to $1,302).
On the Austin side of the I-35 corridor, San Marcos/Kyle rents are $210 higher than in 2020, to $1,598 as of July, the priciest among the submarkets in this group. RBN rents grew by $210 to $1,302, while Lifestyle rates increased by $177 to $1,680. Selma posted the strongest overall gain, rising by $385 to $1,480, almost entirely from the Lifestyle segment, which climbed $387 to $1,486, while RBN rents gained just $48 to $1,031. New Braunfels emerged as San Antonio’s most expensive corridor submarket, with rents up $303 to $1,501. Outlying Guadalupe County, Schertz and Universal City—once below the $1,000 threshold in 2020—all surpassed it by 2025, with Universal City remaining the most affordable despite a $191 increase to $1,104 in July.
Occupancy trends
The occupancy rates in stabilized properties across the I-35 corridor in June were below the 95 percent threshold typically considered ‘healthy’ for the market. Universal City had the highest occupancy, at 93.0 percent, 70 basis points lower than in January 2020. Schertz followed at 92.7 percent (down 1.8 percent) and Outlying Guadalupe County at 92.5 percent (down 1.5 percent). San Marco/Kyle registered 91.5 percent (down 2.2 percent), followed by New Braunfels at 91 percent (down 2.8 percent) and Selma at 85.9 percent, which also posted the steepest drop, down by 7.6 percent.
At the metro level, Austin’s occupancy rate stood at 92.7 percent in June, 20 basis points lower year-over-year and 160 basis points below 2020, trailing the 94.7 percent U.S. rate. RBN occupancy fell the most, down 50 basis points year-over-year to 90.9 percent and down 350 basis points since 2020, as residents migrated from older RBN properties to newly delivered Lifestyle communities. Meanwhile, Lifestyle occupancy dipped modestly, down 20 basis points year-over-year to 93.3 percent and 100 basis points since 2020.
San Antonio’s occupancy trailed Austin’s at 90.7 percent in June, down 60 basis points year-over-year and 170 basis points since 2020. Mirroring Austin, RBN occupancy was impacted the most by robust Lifestyle deliveries, falling 140 basis points year-over-year to 88.9 percent in June, a total decline of 330 basis points since 2020. Lifestyle occupancy held steadier, unchanged year-over-year at 92.4 percent in June, just 40 basis points below the 2020 rate.
The I-35 corridor between Austin and San Antonio illustrates the challenges of balancing rapid supply growth with evolving demand fundamentals. Strong employment and population trends have kept the region outperforming national averages, but the heavy concentration of Lifestyle deliveries has pressured rents and weakened occupancy across submarkets.
As the construction pipeline eases beyond 2025, the region enters a pivotal period in which the pace at which employment gains and demographic growth absorb the wave of new supply will determine how quickly the corridor transitions into a more sustainable cycle of development.