Brooklyn Multifamily Report – January 2023
Despite setbacks, occupancy remains one of the tightest in the country.

Brooklyn rent evolution, click to enlarge
Brooklyn’s multifamily market recorded strong performance at a time when most U.S. markets began seeing the effects of a slowing economy. Anchored by a New York City market that has proved more resilient than expected following pandemic-induced struggles, the borough’s average rent rose 0.3 percent on a trailing three-month basis as of November, as the national rate contracted 0.1 percent. Meanwhile, occupancy was at one of the highest rates in the nation, with the average rate in stabilized assets at 98.6 percent.
READ THE FULL YARDI MATRIX REPORT

Brooklyn sales volume and number of properties sold, click to enlarge
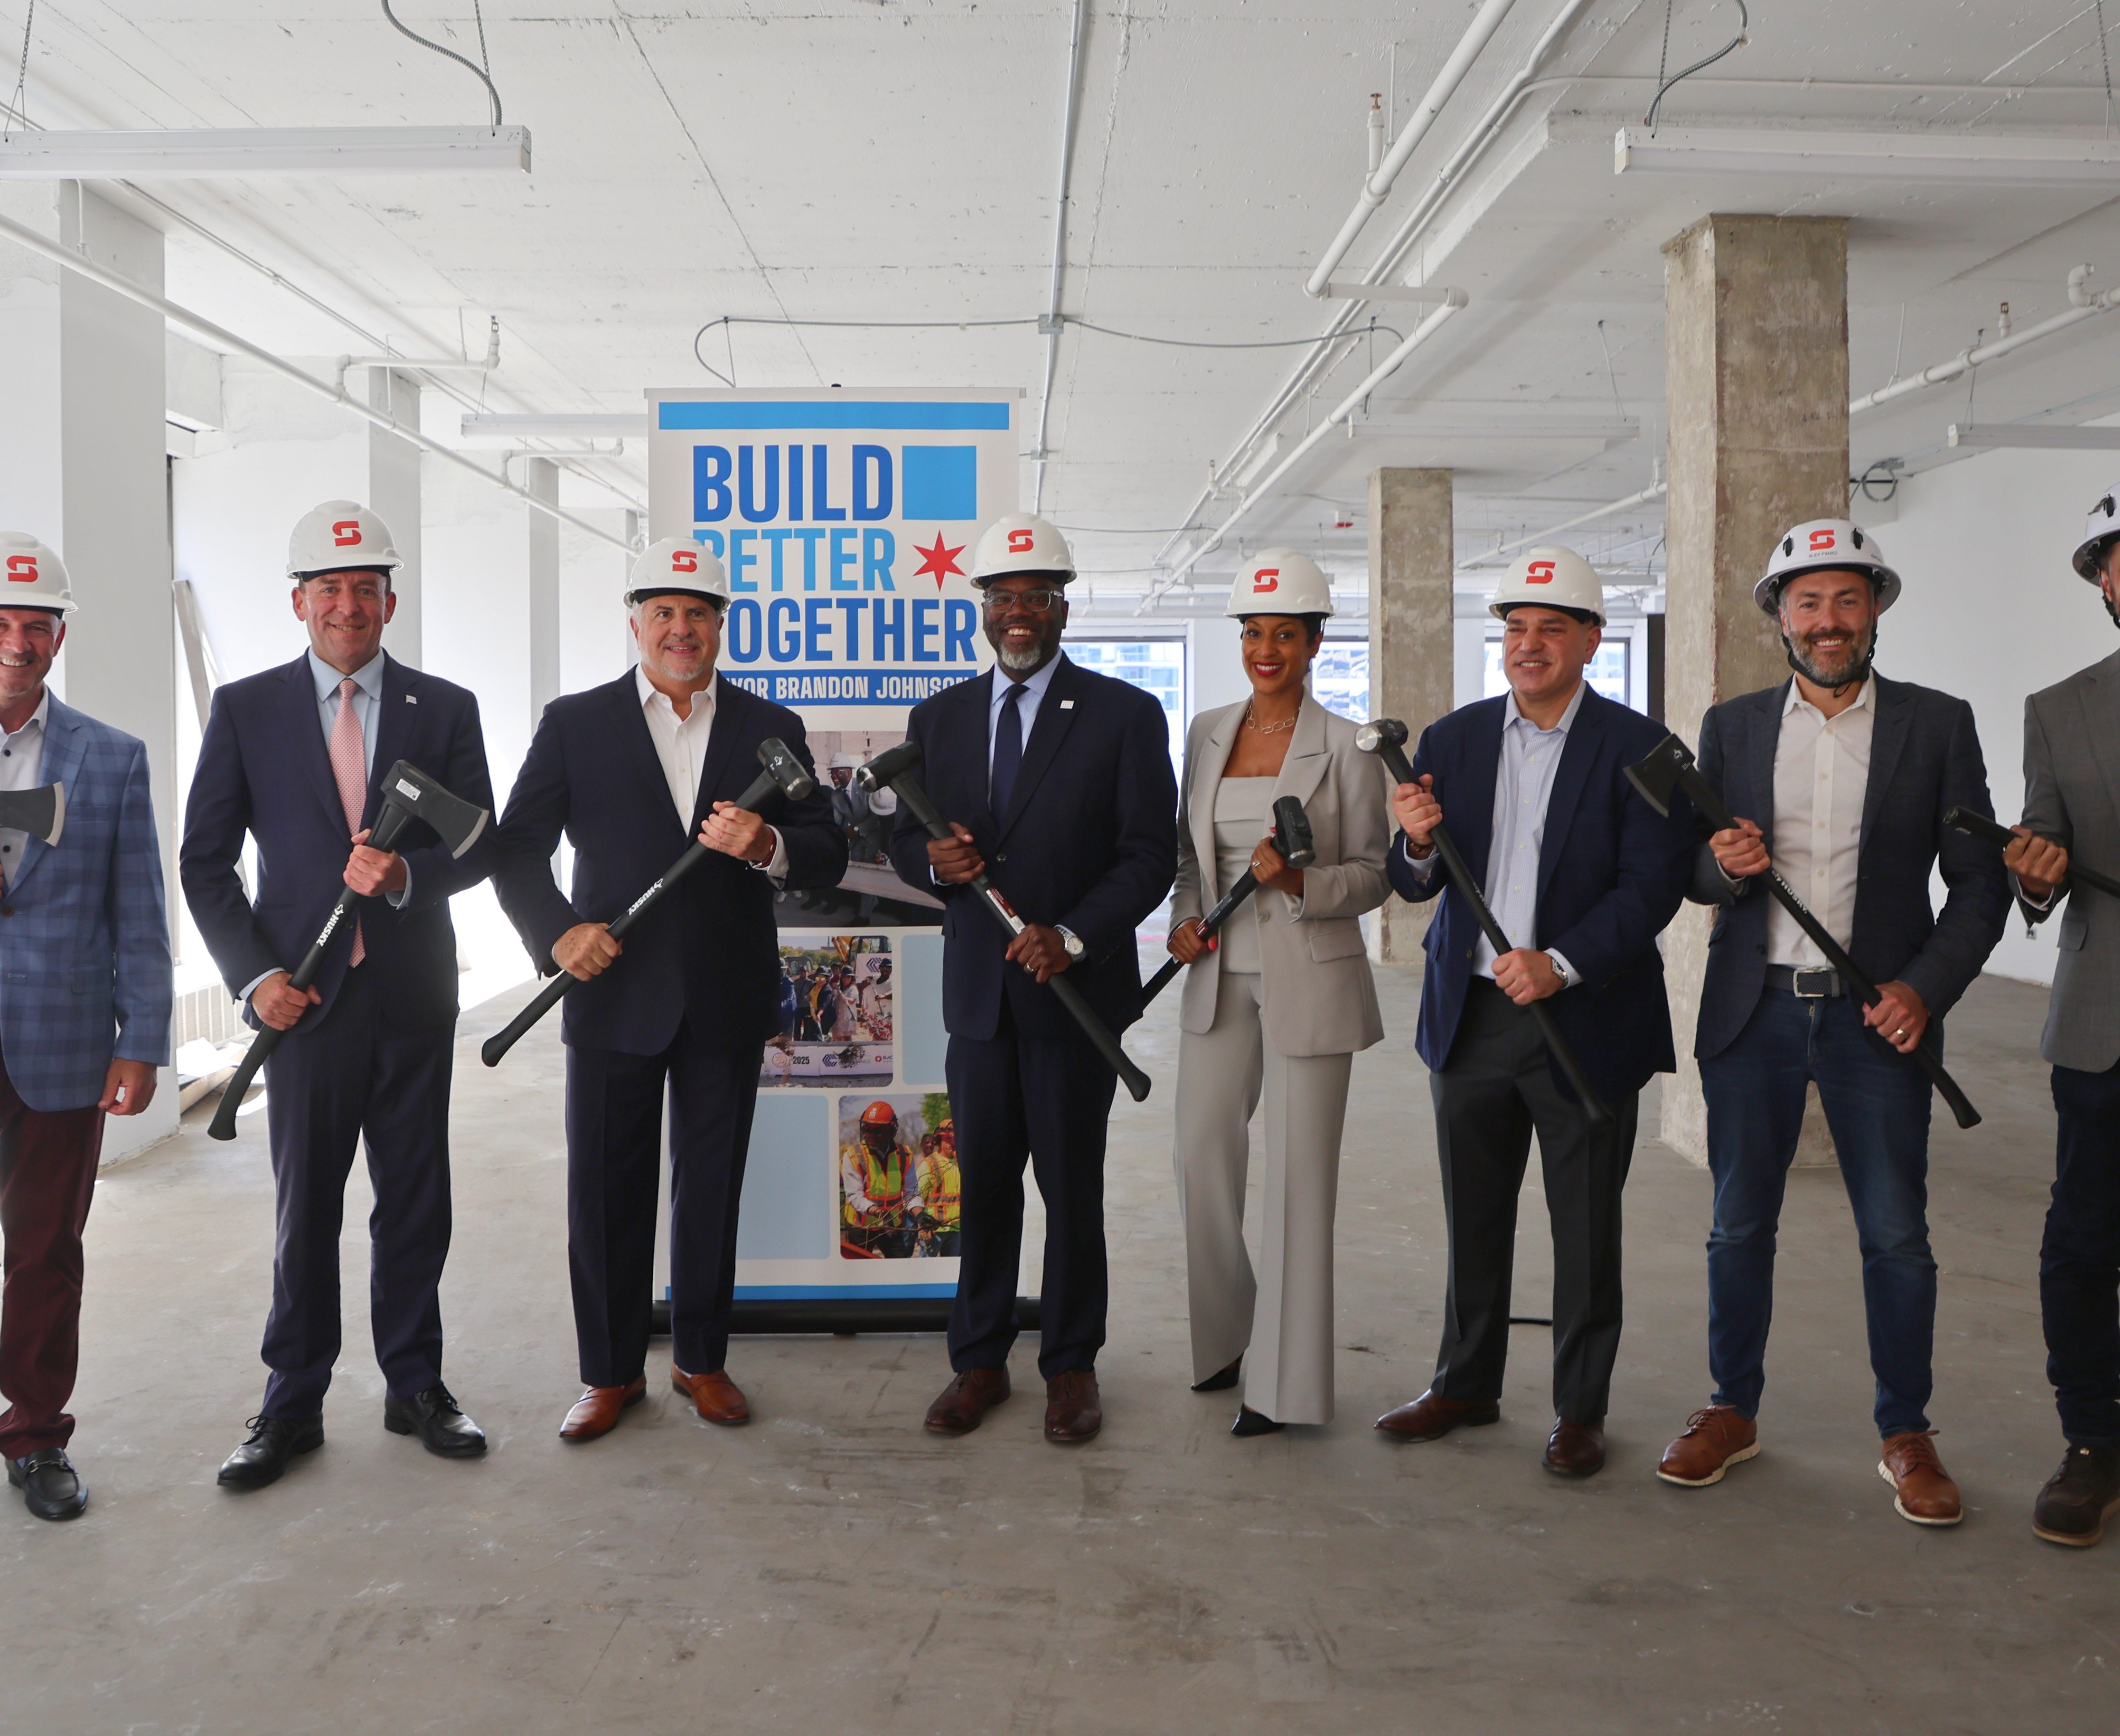
New York City’s job market is still recovering positions lost during the early stages of the pandemic, having added 359,200 jobs in the 12 months ending in September, up 5.8 percent year-over-year. That’s well above the 4.2 percent national rate of employment growth. The $1.2 billion redevelopment of the Brooklyn Development Center campus in East New York will add some 2,400 units of affordable housing to the borough, further boosting the local economy.

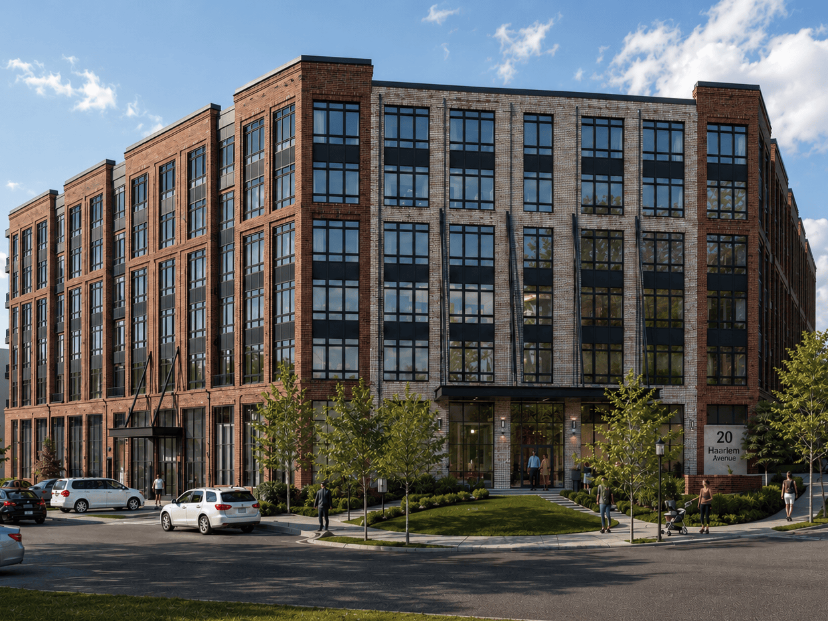
Brooklyn: Image by Wirestock/iStockphoto.com
While heavily oscillating in average sales prices, Brooklyn’s investment volume has had a fairly consistent 24 months, as 2022 kept pace with the prior year. Development in the borough has slowed down, with 2,067 units delivered in the first 11 months of the last year, accounting for 1.4 percent of existing rental inventory. Brooklyn has a mix of housing inventory including condos, co-ops and apartment buildings of fewer than 50 units, so trends will likely fluctuate due to the smaller sample size.