Self Storage National Report – June 2026
The U.S. under-construction pipeline accounted for 2.2 percent of the total existing stock through May, unchanged month-over-month but down 0.3 percent year-over-year.
Strong migration and home sales between 2021 and 2022 drove record self storage performance across Texas, leading to significant development and investment activity. For the past four years, declining home sales and slowing migration have led to oversupply, increased competition and put pressure on rents and returns. Although new supply seems to enter a period of stabilization, advertised self storage rates across Texas metros remain below their 2022 peak and 2020 levels.
Year-over-year, 28 of the top 30 U.S. metros tracked by Yardi Matrix saw a decrease in same-store advertised rents for non-climate-controlled units, as of May. Similarly, 28 of the top metros registered a drop in advertised street rates for climate-controlled units, compared to May 2025, according to the latest Yardi Matrix national self storage report.
On a monthly basis, average advertised street rates per square foot for the 10×10 non-climate and climate-controlled units combined rose 0.8 percent to $16.34 per square foot. Of the top 30 metros tracked by Yardi Matrix, 26 saw positive values in advertised asking rent growth. Detroit, San Diego and Seattle were the only metros whose metrics remained unchanged compared to April 2026. Phoenix closed the list as the only metro to record a drop in average advertised street rates from April through May, contracting 0.1 percent to $15.12 per square foot.
National pipeline registers brief hiatus
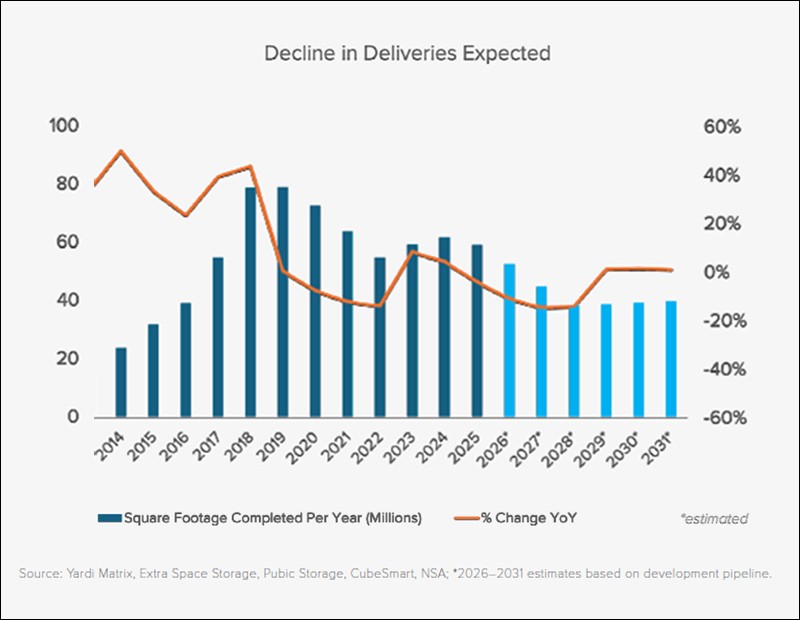
As of May, there were a total of 2,513 self storage properties in all stages of development across the U.S. The pipeline totaled 612 properties under construction, 1,603 planned and 298 prospective projects. The under-construction pipeline accounted for 2.2 percent of the total existing stock through May, unchanged month-over-month but down 0.3 percent year-over-year. During the same month, there were approximately 45.6 million net rentable square feet under construction nationwide.
Out of the top 30 metros, 14 had under-construction pipelines below the national average with the San Francisco Bay Area and Portland, Ore. closing the list for a fourth month in a row, at 0.8 and 0.6 percent, respectively.
Across that same ranking, seven metros recorded an increase in under-construction supply compared to the previous month, namely Phoenix, Austin, Nashville, Los Angeles, Boston, and Portland. Phoenix and Sarasota-Cape Coral ranked first and second on the list for yet another month, with under-construction pipelines clocking in at 6.7 and 5.2 percent from their existing inventories. While Phoenix’s metrics rose 30 basis points month-over-month, Sarasota-Cape Coral’s dropped 30 basis points from April through May.
At the same time, 16 of the metros on Yardi Matrix’s list had their pipelines standing still from April through May, particularly coastal and Sun Belt markets, among which Tampa, San Antonio, San Diego, Washington, D.C., New York City, Philadelphia and the Inland Empire.