As Interest Rates Rise, Where Do Valuations and Transaction Volumes Go?
Despite increasing capital costs, investment activity remains strong and growing in some secondary and tertiary markets, as investors reach further outside their traditional comfort zones to secure yield.
Years of warnings that rising Treasury rates would depress commercial real estate prices—during an extended period when rates stayed low and acquisition yields fell to record lows—have given the concept a “boy who cries wolf” quality.
Those warnings, however, will be tested now that the 10-year Treasury seems poised to continue its growth of the past 18 months, and volatility has roiled the bond and equity markets. No longer can the market rely on the unusually large premium between Treasury rates and cap rates to buffer the impact of higher interest rates and the likely increase in mortgage coupons.
The recent increase in Treasury rates has not yet caused much change to property values. A compression of debt spreads has kept mortgage rates from keeping pace with the rise in Treasury rates, while equity return expectations have also contracted due to higher debt costs and stagnant property yields.
Looking ahead, we foresee interest rates will continue to climb, with modest a impact on borrowing costs due to tighter debt spreads, strong property fundamentals and continued robust capital flows into the sector. We also expect a shift in capital from core to secondary and tertiary markets as investors seek higher yields in light of the increasing costs to borrow.
National Pricing Flattens, Secondary Markets Emerge
From November 2016 through early 2017, long-term interest rates spiked on the speculation of faster economic growth and higher inflation. Our prediction that acquisition yields would increase and reduce property values did not hold up. Despite the near 100-basis point increase in the 10-year Treasury rate in the year that followed, property values have changed little. The national average price per multifamily unit increased 2% in 2017, to $129,712.
| 2014 | $100,545 |
| 2015 | $113,408 |
| 2016 | $127,140 |
| 2017 | $129,712 |
U.S. multifamily transaction volume was nearly $100 billion in 2017. Most markets did not see a major change in activity, though there were declines in primary markets such as Manhattan, San Francisco and Los Angeles and markets with high development levels such as Portland, Ore., Denver and Austin, Texas.
Source: Yardi Matrix
However, the market remained liquid and buyers continued to accept high prices at the negotiating table. Capital flows were positive, while investors continued to be bullish on multifamily, as late-cycle secondary markets such as Orlando, Phoenix, Dallas and Tampa, Fla., have emerged as the most attractive locations for buyers to sink their cash. Prices have increased steadily in these markets on a per-unit and per-square-foot basis from 2014 through 2017.

Source: Yardi Matrix
So if interest rates went up, but valuations didn’t fall, what happened? For one, investor demand remains strong. Equity investors with capital to deploy are willing to accept slightly lower returns than they had previously earned earlier in the cycle. Another factor is that debt costs remain attractive for borrowers. Loan spreads have tightened, so the all-in cost to borrowers is not as much as the increase in Treasury rates. And buyers remain optimistic about increases in rents, even if the growth is moderate.
Risk-Sharing Ratchets Up
At this stage in the cycle, investors and lenders are sharing the additional risk present in commercial real estate deals as interest rates increase but property yields remain stagnant.
Although Treasury rates are rising, the cost of debt has not been moving in lock step. The 10-year treasury rose about 40 basis points over the past 12 months, while the average cost of debt originated by the Government Sponsored Enterprises (GSEs) has increased by about 25 basis points, according to PGIM. The average spread of a 10-year loan dropped by roughly 15 basis points to 185 basis points over the Treasury yield, and spreads could further compress.
One reason for the compression is competition in the debt space, especially for multifamily loans. A growing number of institutional investors are channeling capital to debt funds as a way of diversifying their risk. This late in the cycle, many funds deem it wise to issue debt and assume second-lien risk, rather than execute an equity strategy which would leave them with first-lien risk and the possibility of greater and faster losses in the event of a downturn.
The result for borrowers is that interest rate increases have not been quite as drastic as the headlines imply, although even the small increase in debt costs have made some deals harder to pencil, particularly those with low debt service coverage ratios.
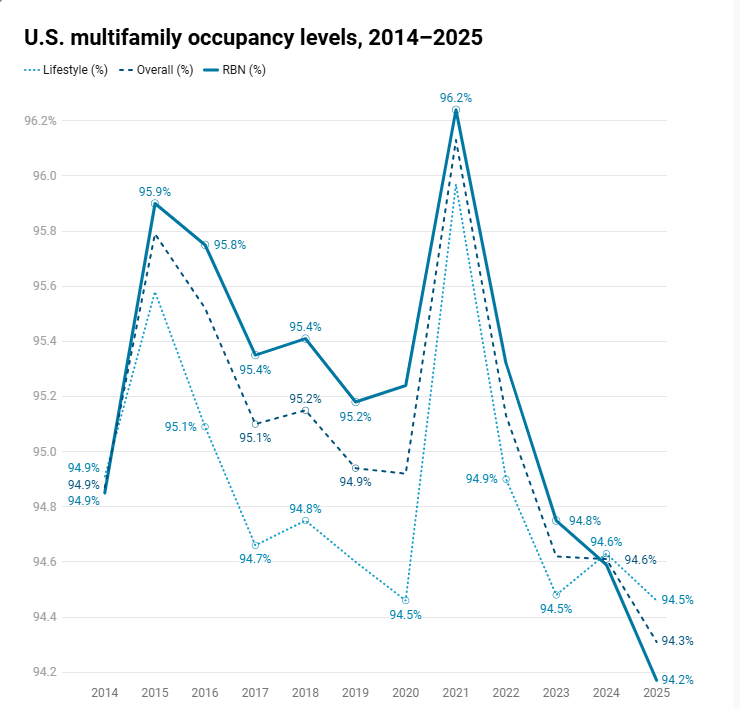
Increasing borrowing costs have yet to put a dent in going-in cap rates, which remain near historic lows. Multifamily continues to be sought for its steady cash flow, and rent growth remains in the 2.5% range, roughly in line with the historical average. U.S. multifamily rent growth has remained within a 40-basis point range for 14 consecutive months, according to Yardi Matrix. While fundamentals vary by market, and investors differentiate by property age and quality, the overall trend has been a stabilization in cap rates.

Source: Yardi Matrix
What happens if interest rates and inflation rise, as expected due to sustained economic growth, driven predominantly by a healthy employment market and the increasing price of oil? We expect commercial mortgage rates to increase, even as loan spreads likely continue to compress modestly. Investors remain well capitalized, and demand for multifamily properties remains high, especially in secondary markets with diverse and growing economies. Demographic tailwinds will continue to propel the market, but flat cap rates, rising expenses and debt coverage will reduce the margin of error for property investors. Apartment trades will continue, with limited declines in valuation, as demand fundamentals, ample capital and relatively tame borrowing costs continue to support transactions.
Multifamily mortgage coupons have moved very little over the past five years, according to Yardi Matrix data. The average coupon of loans originated on multifamily properties in the U.S. in 2017 was 4.24%, the same as in 2014. The average coupon of new loans dropped as low as 4.01% in 2016, further supporting increased transaction activity, but has remained within a 25-basis point range since 2014.
Looking ahead
At the national level, we foresee continued strong multifamily transaction volume, despite the decline in 2017 from the market peak. We also expect pricing to hold up. The average price per unit has increased steadily over the past five years. Prices per square foot followed a similar trend, indicating that the properties being transacted are holding their value despite increased loan rates.
On the metro level, the data points to a softening in deal flow and pricing in metros where rents are expected to weaken, either gateway metros such as San Francisco, Chicago and New York where high rents are an issue, or growing metros with a large amount of deliveries such as Denver and Nashville. However, investment activity remains strong and growing in some secondary and tertiary markets, as investors reach further outside their traditional comfort zone to secure yield.