

Finance (Research Center)
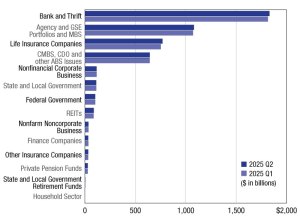
Multifamily Mortgage Debt Outstanding Increased in Q2
Every major capital source added to its holdings, but growth varied.
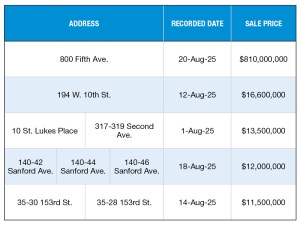
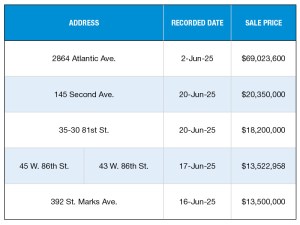
Top 5 NYC Multifamily Building Sales—August 2025
Here are the metro’s top deals for the sector, collected monthly by PropertyShark.
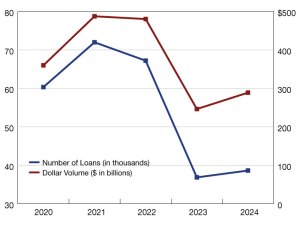
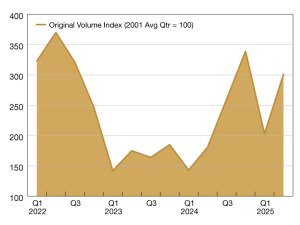
Multifamily Lending Increased Marginally in 2024
Read the Mortgage Bankers Association’s annual report of the multifamily lending market.
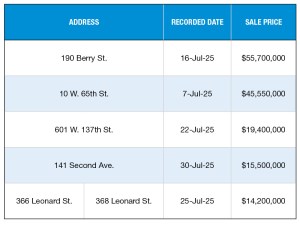
Top 5 NYC Multifamily Building Sales—July 2025
PropertyShark collected the city’s top deals for the sector.
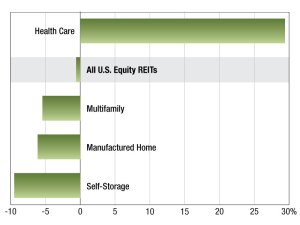
2025 Multifamily REIT Returns
Performance data from S&P Global Real Estate. Read the report.
Multifamily, Commercial Lending Jump in Q2: MBA
GSEs and life companies were among the sources boosting their year-over-year volume the most. Read the report.
Top 5 NYC Multifamily Building Sales—June 2025
A roundup of recent major transactions put together by PropertyShark.


Top 5 NYC Multifamily Building Sales—May 2025
The metro’s top deals for the sector rounded up by PropertyShark.

Top 5 NYC Multifamily Building Sales—April 2025
PropertyShark collected the city’s top deals for the sector.