

Finance (Research Center)
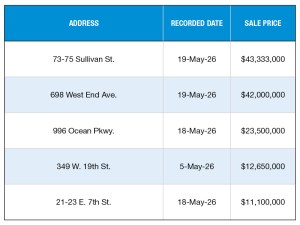
Top 5 NYC Multifamily Building Sales—May 2026
These are the top five largest transactions in New York City, according to PropertyShark.
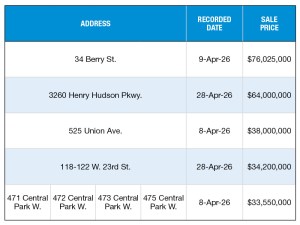
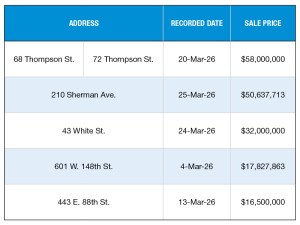
Top 5 NYC Multifamily Building Sales—April 2026
PropertyShark collected the largest sales for the multifamily sector in New York City.
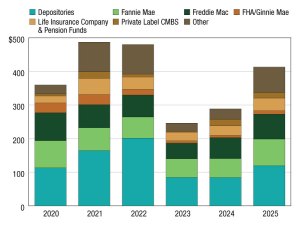
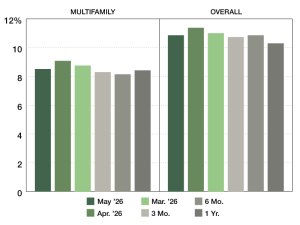
Multifamily, Commercial Real Estate Lending Jumped 40% in 2025
The increase showed growing confidence across the real estate finance market, according to the Mortgage Bankers Association.
Top 5 NYC Multifamily Building Sales—March 2026
These are the city’s largest deals of the month, according to PropertyShark.
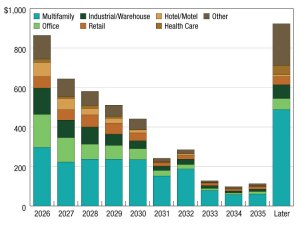
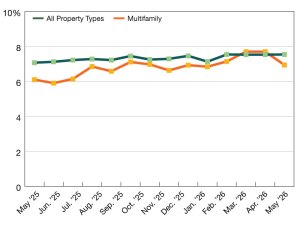
Loan Maturity Snapshot: How’s 2026 Shaping Up?
The latest Mortgage Bankers Association trends report points to a stronger year for originations.
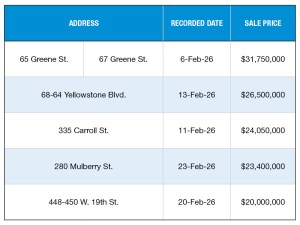
Top 5 NYC Multifamily Building Sales—February 2026
A list of New York City’s top deals for the sector, based on PropertyShark data.
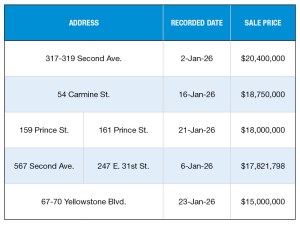
Top 5 NYC Multifamily Building Sales—January 2026
PropertyShark collected New York City’s top deals for the multifamily sector.
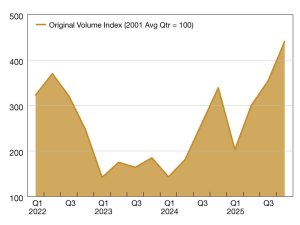
Commercial, Multifamily Borrowing Rise in Q4 2025
Originations went up for most asset classes.