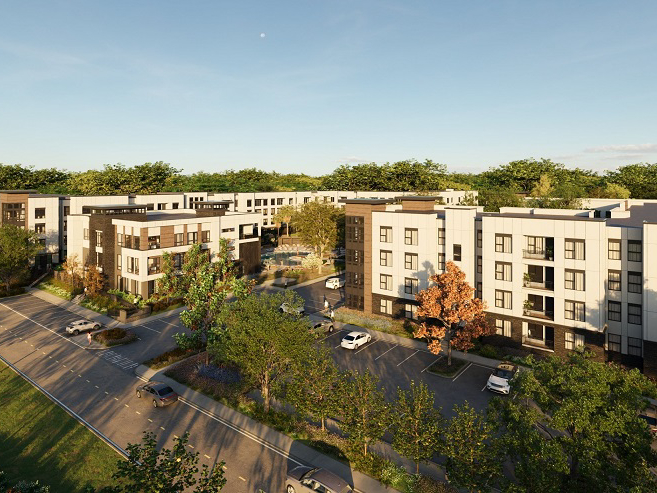
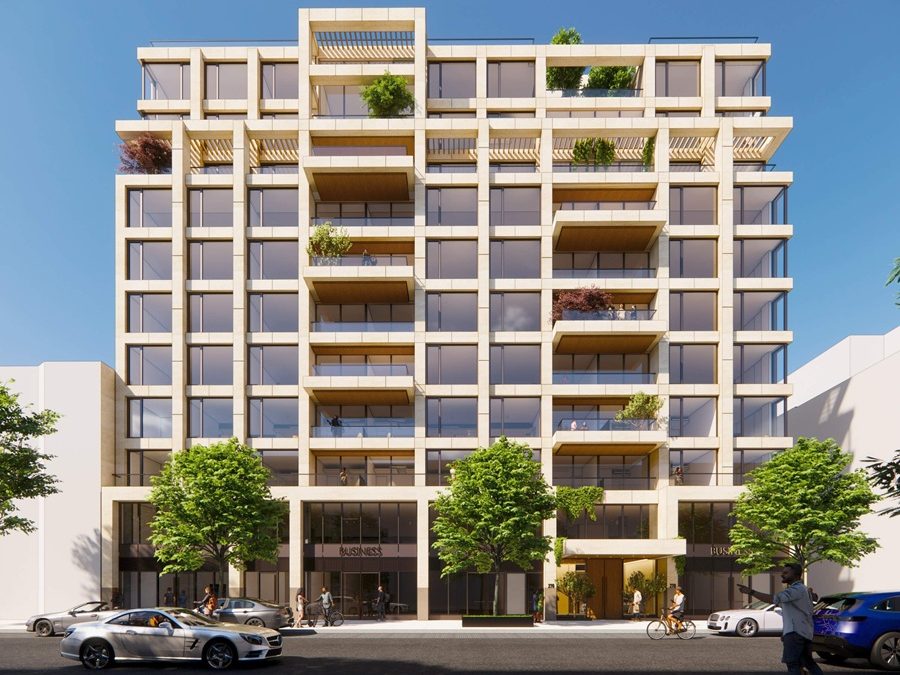
Economy Watch: Housing Price Appreciation Slows
S&P Dow Jones Indices reported that its S&P/Case-Shiller Home Price Indices were up 13.5 percent and 13.2 percent year-over-year, respectively, for its 10- and 20-city composite indexes in January.
By Dees Stribling, Contributing Editor
S&P Dow Jones Indices reported on Tuesday that its S&P/Case-Shiller Home Price Indices were up 13.5 percent and 13.2 percent year-over-year, respectively, for its 10- and 20-city composite indexes in January. Twelve cities and the 20-city composite saw their annual rates drop compared with December, hinting at slower appreciation for many housing markets. Both composites are roughly back to where they were in mid-2004.
Warm-weather cities showed the highest monthly increases, with Las Vegas up 1.1 percent, Miami increasing 0.7 percent, and San Diego advancing 0.6 percent. New York and Washington, D.C., posted their highest year-over-year increases since 2006, and Dallas and Denver are the only cities to have reached new record peak valuations. Detroit has the dubious distinction of being the only city with home prices lower than in 2000.
“The housing recovery may have taken a breather due to the cold weather,” David M. Blitzer, chairman of the Index Committee at S&P Dow Jones Indices, notes. “Twelve cities reported declining prices in January vs. December; eight of those were worse than the month before. From the bottom in 2012, prices are up 23 percent and the housing market is showing signs of moving forward with more normal price increases.”
New home sales edge down
In other housing news, sales of new single-family houses in February 2014 were at an annualized rate of 440,000 units, according to estimates released by the Census Bureau and HUD. That’s 3.3 percent below the revised January rate of 455,000 units, and 1.1 percent lower than in February 2013.
Even with the downward wobble, sales are roughly where they’ve been since the end of the recession—namely, nowheresville, at least when compared with the decades since the early 1960s, when the government started tracking new home sales. From the ’70s to the ’90s, the rate of new home sales hovered between 600,000 and 800,000 units during non-recessionary periods, spiking to over 1 million in the 2000s, just before the crash. Only during the worst of the late 20th-century recessions (such as 1974 and 1981) was the rate as low as 400,000 units.
As for inventory, the Census Bureau says that the number of new houses for sale at the end of February was 189,000. That represents a supply of 5.2 months at the current sales rate, which is a “normal” supply (i.e., less than six months). According to the bureau, a house is considered for sale when a permit to build has been issued or work has begun on the footings or foundation in non-permit areas; also, a sales contract hasn’t been signed nor a deposit accepted.
Wall Street experienced an up day on Tuesday, with the Dow Jones Industrial Average gaining 91.19 points, or 0.56 percent. The S&P 500 was up 0.44 percent and the Nasdaq advanced 0.19 percent.