National Student Housing Report – June 2026
Preleasing remained ahead of last year’s pace in May, but new supply and slowing rent growth continued to pressure some markets, Yardi Matrix data shows.

Preleasing at Yardi 200 universities reached 78 percent in May for the upcoming academic year, 140 basis points ahead of last year’s figure, according to the latest Yardi Matrix student housing report. However, this marked a slowdown from the May average registered between 2022 and 2024, as operators entered the summer needing additional leasing momentum to reach occupancy levels recorded in recent years.
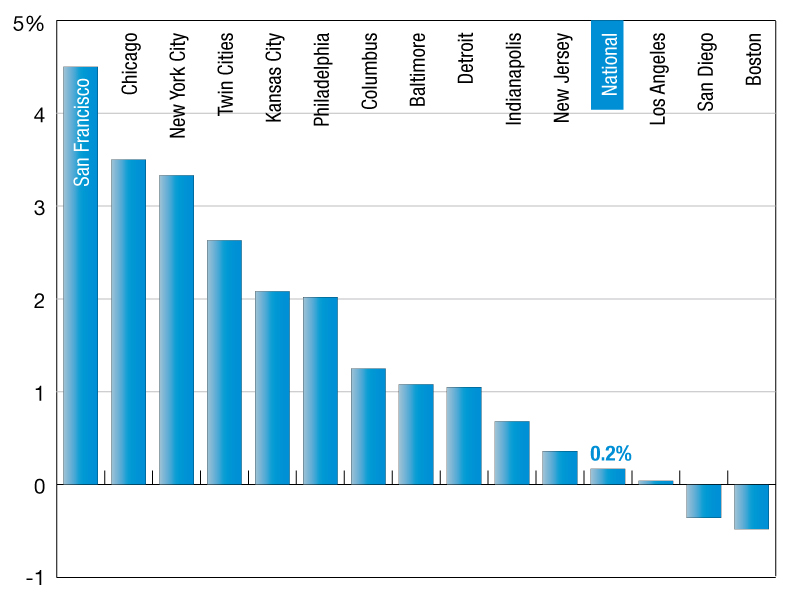
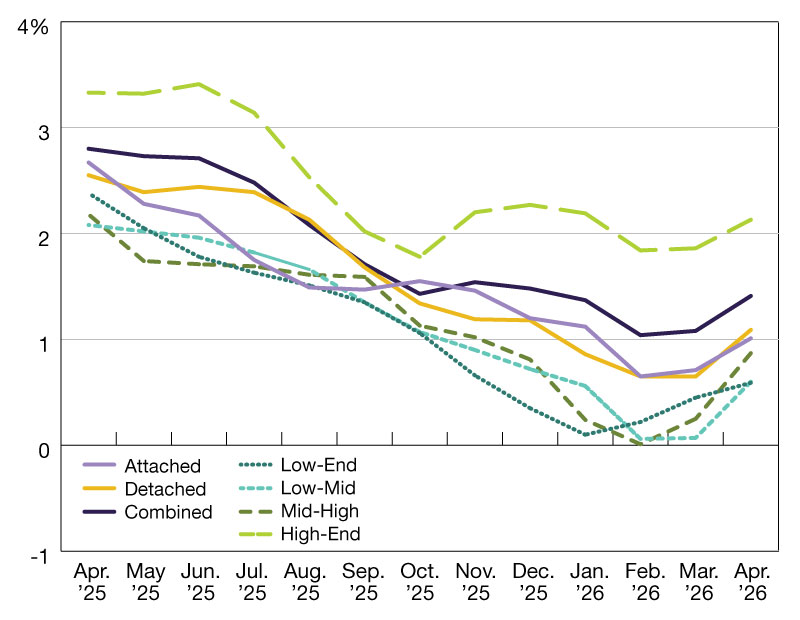
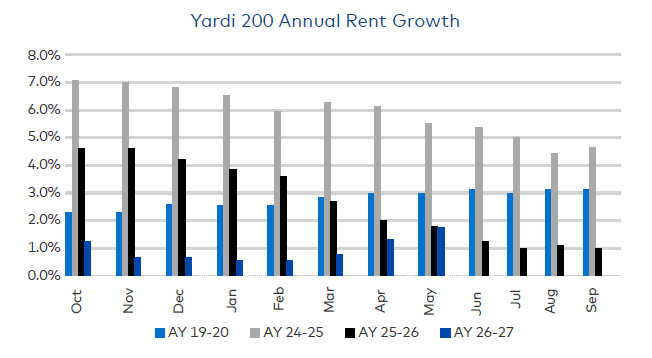
The average advertised asking rent per bed at Yardi 200 schools rose to $933 in May, up 0.2 percent from April and 1.7 percent year-over-year. The month-over-month increase marked the ninth consecutive gain, signaling stabilization after rents declined through the summer in the prior two leasing cycles. Still, rent growth across the current leasing season averaged only 0.9 percent, well below the 2.6 percent posted during the 2025-2026 leasing season.
Preleasing performance remained uneven. While 63 percent of student housing markets were ahead of last year’s pace, some schools continued to trail as new supply competed for tenants. Eleven universities have more than 1,000 beds delivering this year, including seven that also added supply in 2025. On average, preleasing at these schools was 4.5 percent behind last year’s level.
Preleasing approaches the summer stretch
Several universities have already approached or surpassed last fall’s final occupancy levels. Northern Arizona was 93.3 percent preleased as of May, compared to 92.2 percent occupancy last fall, while Iowa was 92.1 percent preleased, above its 91.4 percent fall occupancy rate. Virginia Tech, University of Missouri, Penn State and Boise State were also within three percentage points of last year’s occupancy.
The divide between leading and lagging markets widened further. The 50 highest-preleased markets averaged 92.1 percent in May and were 9.5 percent ahead year-over-year. Meanwhile, the 50 lowest-preleased markets averaged 54 percent and were 8.5 percent behind last year’s pace.
Northern Arizona posted the highest year-over-year growth in percentage preleased, at 20 percent. The university was followed by University of Louisville at 19.2 percent, University of Washington at 18 percent and University of Iowa at 16.6 percent.
Rent growth also varied sharply by market. The 50 strongest markets for rent growth averaged 6.7 percent annual growth in May, while the 50 weakest markets posted an average decline of 4.1 percent. Purdue recorded one of the steepest rent declines, with rates down 10.3 percent year-over-year to $875 per bed. At Nevada-Reno, rents increased 8.5 percent year-over-year to $883 per bed.
Development and leasing uncertainty have weighed on investment activity. As of the end of May, 30 student housing properties totaling 16,303 beds had traded in 2026, down 44 percent from the 51 properties and 29,248 beds sold during the same period last year. Pricing also declined, with average sale prices at $68,300 per bed so far in 2026, compared to $91,750 per bed in 2025.