National Multifamily Report – May 2026
Annual growth turns positive following two consecutive monthly improvements, according to Yardi Matrix.
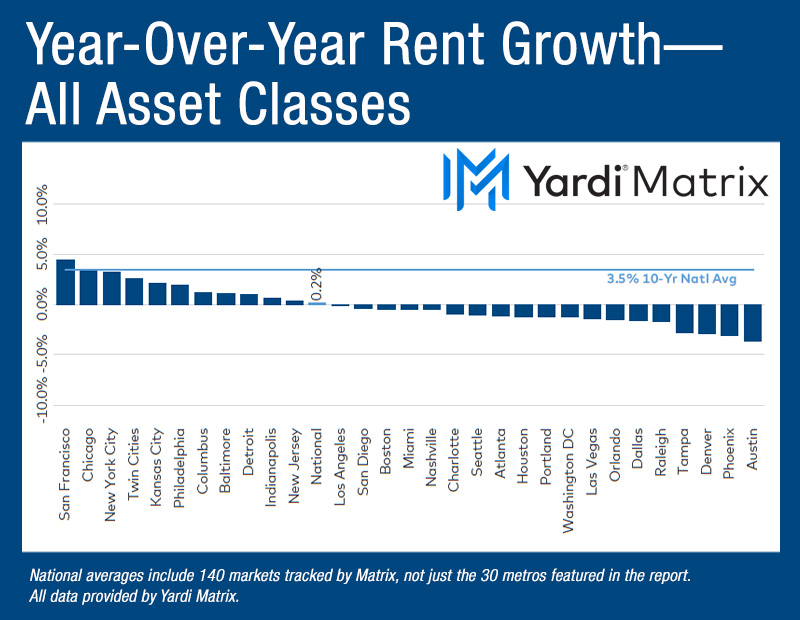
Average advertised asking rents across the U.S. multifamily sector rose for two months in a row, though yearly growth remained tepid at just 0.2 percent in May, according to Yardi Matrix’s latest survey of 140 markets. The figure clocked in at $1,767 in May, $6 above the April reading. The single-family build-to-rent sector continued improving its pricing power, with average advertised rents up $8 month-over-month to $2,224 in May, though still down 0.1 percent compared to last year.
The usual Gateway and Midwest markets recorded yearly gains, such as San Francisco (4.5 percent), Chicago (3.5 percent) and New York City, while high-supply metros continued posting negative movement, including Austin, Texas (-3.7 percent), Phoenix (-3.1 percent) and Denver (-2.9 percent). Meanwhile, the national occupancy rate dropped more than 200 basis points from its cycle peak in 2022, to just 94.1 percent in April—the lowest level since 2013. The sole major market to register positive occupancy growth was San Francisco, with the rate ticking up 0.2 percent on an annual basis on account of AI-related job growth.
Seasonal growth lifts rates nearly all across the board
Seasonal variance drove short-term gains as monthly advertised rents ticked up 0.3 percent in May. Through the first five months of 2026, the figure stood at 1 percent, on par with the past four years but below the pre-pandemic norm of roughly 2 percent. Nearly all markets saw an improvement in May, including a large number of the supply-burdened metros. The strongest increases emerged in New York City (1.2 percent), Baltimore and Charlotte, N.C. (0.9 percent each), while the steepest declines were posted across Phoenix (-0.4 percent) and Indianapolis (-0.2 percent).
Inflation uncertainty spurred by the war in Iran, as well as higher-for-longer rates, were among the factors that led to a decrease in the multifamily transaction volume. Year-to-date through May, some $26.6 billion changed hands in multifamily deals, 10.7 percent below last year’s figure registered during the same interval. Dry powder exists, as investment vehicles accumulated $174 billion for U.S. multifamily deals on a two-year rolling basis through March 2026, the most across any asset class, according to Colliers. However, it appears sellers aren’t yet willing to divest amid wide bid-ask spreads.
While the average advertised national single-family build-to-rent rates were nearly flat, down just 0.1 percent in May, performance varies significantly at a regional level. Mirroring multifamily trends, many Midwest markets recorded strong growth, such as Chicago (7.2 percent), South Dakota (5.3 percent), Columbus, Ohio (4.5 percent) and Kansas City (4.3 percent). Similarly, rents across many Sun Belt markets dipped into the red, including Austin (-3.4 percent), Phoenix and Denver (-3.2 percent each), Greenville, S.C. (-3.1 percent) and Dallas (-2.7 percent). The nearly 11 percent gap between the strongest and weakest BTR markets underscores a larger bifurcation compared to the multifamily sector, where the gap was 8 percent.
Read the full Yardi Matrix multifamily real estate report.