Top 10 US Markets for Multifamily Construction
The metros with the largest multifamily pipelines show a propensity for upscale construction, according to five years of Yardi Matrix data.
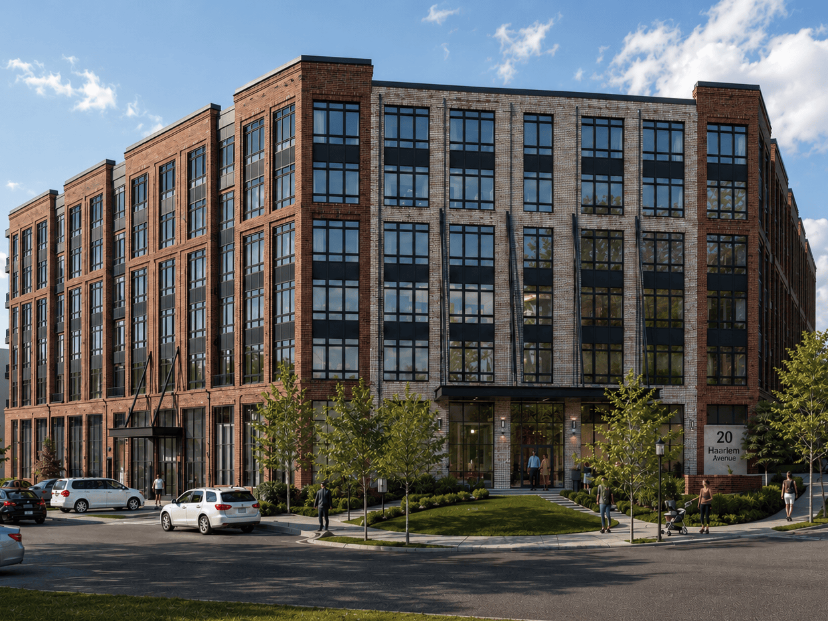
Despite numerous headwinds, including a challenging financing landscape and a shortage in skilled labor, the U.S. multifamily stock added 672,047 units in 2024, the highest annual volume on record. As of April, the under-construction multifamily pipeline remained robust, totaling 1,034,611 units across 4,774 properties, according to data provided by Yardi Matrix. The inventory composition is still made up of predominantly upscale Lifestyle properties, which account for 80 percent, while fully affordable and Renter-by-Necessity units took up just 15 percent and 5 percent.
Yardi Matrix’s top 30 metros accounted for nearly 65 percent of the units underway as of April, 23 of which had more than 10,000 units under construction. One-third had more than 20,000 units underway, while the top three each exceeded 40,000 units.
How does the influx of supply impact fundamentals in the metros leading in under-construction multifamily pipeline, and which are these? Focusing on the top 10 metros by pipeline volume as of April 2025, we’ve reviewed metrics including asset class distribution, volumes delivered since 2020, and average days under construction.
1. Dallas-Fort Worth
Dallas–Fort Worth led the way in amount of units under construction, with a multifamily pipeline of 60,535 units. That’s 30 percent higher than the second-ranked metro. Lifestyle units accounted for more than 86 percent of the units underway, while fully affordable took a 9 percent share and RBN 5 percent.
DFW deliveries in 2025 through April amounted to 7,609 units, 6,543 of which were Lifestyle, followed by RBN (826 units) and fully affordable (240 units). Since 2020, the metro addded 156,148 units, with the highest volumes recorded in 2024 (40,943 units) and the slowest in 2022 (25,442 units). During the interval, the Lifestyle segment rose by 142,770 units, RBN by 4,959 units and fully affordable by 8,419 units.
Deliveries of fully affordable properties increased annually over the 2020 to 2024 timeframe, except for a drop in 2021 to 801 units. In 2025 through April, one 240-unit fully affordable community came online. Meanwhile, RBN stock growth was lowest in 2022 (314 units) and highest in 2024 (2,158 units). So far this year, 826 RBN units were delivered. The Lifestyle sector accounted for the bulk of deliveries during the interval, at an average of 27,200 units per year.
The average number of days under construction across asset classes was lowest for RBN projects (628 days), while Lifestyle and fully affordable were in a similar range, at 724 and 730 days. The Metroplex ranked fifth among Yardi Matrix’s top 30 metros by highest number of days under construction for fully affordable projects, only trailing Austin, New Jersey and three coastal gateway markets—New York, Los Angeles and San Francisco. However, it made the top ten list by shortest construction times for Lifestyle properties and ranked fourth shortest for RBN, surpassed by Atlanta, Washington D.C., and Chicago.
2. New York City
New York occupies the second position by under-construction multifamily pipeline as of April, with 46,368 units underway. Developers focused on upscale projects, with Lifestyle accounting for 73 percent of the units underway; the remaining share was split into 20 percent fully affordable and 7 percent RBN.
Developers delivered 3,315 units through April, with no RBN additions, just 3,207 Lifestyle and 108 fully affordable units. Over the 2020 to 2024 period, New York gained 50,172 units, with the best years in deliveries in 2022 (13,185 units) and 2024 (12,057 units), and the lowest year in 2021 (3,381 units). The Lifestyle stock grew by 30,513 units during the interval, with peak years in 2022 (8,884 units) and 2023 (7,942 units), and the 33,514-unit under-construction pipeline will likely keep 2025 deliveries high. Meanwhile, the fully affordable segment gained 14,240 units, with peak years over the period in 2024 (4,259 units) and 2022 (3,994 units) and a 9,531-unit pipeline as of April. RBN increased by just 2,104 units over the period, lacking completely in 2021 and 2022.
It takes New York longest of all top 30 Yardi Matrix metros to complete the construction of a fully affordable property (868 days average), but locally, it takes less time than building a Lifestyle asset (879 days), or a RBN project (1,047 days)—for which it ranked second longest, trailing Phoenix (1,217 days) and on par with Detroit.
3. Phoenix
Phoenix had 44,331 units under construction as of April, with upscale units accounting for 89 percent, while 10 percent were fully affordable apartments. RBN units were barely present with just 1 percent.
Completions through April amounted to 6,618 units, with gains serving mostly the Lifestyle segment (5,761 units), while RBN added 641 units and fully affordable 216 units. Supply growth increased progressively between 2020 and 2024, excelling in 2024 with 24,051 units, up from the 9,263 units added in 2020. Lifestyle stock expansion set the trend of the overall supply growth in the metro, marking progressive increases over the period for a total of 65,000 units. Meanwhile, the RBN segment added 4,174 units, with top performance recorded in 2024 (1,429 units) and 2021 (1,129 units). The fully affordable segment gained 4,625 units, half of which (2,327 units) was added in 2024.
Phoenix led all Yardi Matrix’s top 30 metros by days under construction for RB Properties, with an average of 1,217 days. Meanwhile, fully affordable properties averaged only 554 days, less than half RBN’s average and the sixth fastest overall by delivery time, on par with Kansas City and slower than Portland (587 days). Lifestyle averaged 739 days under construction, among the upper half of the top 30 metros by delivery time, flanked by Boston (738 days) and Tampa (741 days).
4. Austin
Austin ranked fourth in under-construction multifamily pipeline, with 38,796 units underway as of April. Three-quarters of the pipeline were Lifestyle units, with fully affordable taking 22 percent and RBN just shy of 3 percent.
Between 2020 and 2024, developers added 94,251 units to Austin’s stock and the supply surge continues. In 2025 through April, 10,458 units came online in the metro, following a volume of 29,387 units in 2024, more than double the 13,895-unit size recorded in 2020. By composition, the Lifestyle inventory grew by 78,533 units during the five-year period, with the segment gaining another 9,386 units in 2025 through April. The fully affordable segment added 13,343 units between 2020 and 2024, plus 838 in 2025 through April, and RBN lagged with just 2,375 units during the period and 234 in 2025 through April.
With an average of 800 days under construction for fully affordable properties, Austin’s delivery time was the second longest among Yardi Matrix’s top 30 metros, only trailing New York (868 days). Still, delivery time for fully affordable properties was faster than that in the Lifestyle (807 days) and RBN (957 days) segments. RBN was the fourth longest among the top 30 metros, and the only one below the 1,000-day mark.
5. Charlotte
Charlotte’s under-construction multifamily pipeline through April only surpassed New Jersey’s by 305 units, with a total volume of 36,873 units. The composition heavily favored the Lifestyle segment, which accounted for 90 percent, while fully affordable units were at almost 7 percent and RBN units for less than 3 percent.
The metro’s rental inventory saw a significant influx between 2020 and 2024, when 55,862 units were added. In 2025 through April, another 4,572 units had come online. The composition of Charlotte’s deliveries was also heavily tilted toward the Lifestyle segment, totaling 48,157 units during the five-year period, plus 3,830 units in 2025 through April. Meanwhile, fully affordable accounted for 6,078 units between 2020 and 2024. RBN trailed here as well, with only 1,627 units delivered during the four-year interval.
Construction times in the metro also occupied a middling position among the top 30 metros. Locally, fully affordable developments took the least time (632 days), on par with Indianapolis, but faster than Raleigh (650 days). Next in line came RBN with an average of 725 days under construction, on par with Orlando and slower than Raleigh (695 days). Lifestyle took the longest to build, at an average of 787 days, faster than Nashville (852 days) and just a tad slower than in Raleigh (781 days).
6. New Jersey
New Jersey’s under-construction multifamily pipeline had 36,568 units as of April, nearly 93 percent of which will add to Lifestyle inventory, with fully affordable accounting for less than 3 percent and RBN for only 4 percent.
New Jersey’s stock increased steadily over the 2020 to 2024 period, for a total of 61,604 units, and another 3,738 units delivered in 2025 through April. A substantial 54,168 units were added to the Lifestyle segment, which saw its best year for deliveries in 2023 (13,510 units). Renter-by-Necessity stock gained just 3,535 units during the interval, nearly half of which were delivered in 2024. Fully affordable housing stock added 3,901 units between 2020 and 2024 and 265 units through the first third of 2025.
Fully affordable projects were delivered at the quickest rate, with an average of 782 days under construction. New Jersey ranked third for longest construction time among Yardi Matrix’s top 30 metros, behind New York and Austin. RBN projects delivery times averaged 843 days, faster than in New York and Los Angeles (874 days). Lifestyle units took longest to build, averaging 930 days under construction, ranking fourth, behind Seattle (932 days), Los Angeles (943 days) and Detroit (986 days).
7. Miami
Developers had 33,989 units underway in Miami as of April. Lifestyle units accounted for 80 percent of the pipeline, fully affordable for 18 percent and RBN for 2 percent.
Miami’s rental inventory gained 81,295 units between 2020 and 2024, peaking at 21,717 units in 2024. Another 3,595 units came online in 2025 through April, with no RBN apartments coming online. Lifestyle (3,237 units) and fully affordable (358 units) made up all incoming units. During the five-year period, the metro’s Lifestyle inventory added 68,603 units. Construction of RBN units was limited, at 2,159 units. Fully affordable stock added 10,533 units, 8,000 of which were delivered since 2022.
RBN units averaged 642 days under construction, fastest among asset classes locally and sixth fastest among Yardi Matrix’s top metros. Fully affordable units averaged 650 days under construction, surpassing metros including Dallas, Orlando and Houston. Lifestyle took the longest to build with an average time of 820 days under construction, outperforming metros including Washington, D.C., Nashville (852 days) and Seattle (932 days).
8. Atlanta
Atlanta had 33,907 units under construction as of April, just 82 units short of Miami’s total. Lifestyle apartments took 90 percent of the pipeline, fully affordable 6 percent and RBN 4 percent.
Developers delivered 95,019 units in Atlanta between 2020 and 2024. Inventory growth increased progressively each year during the five-year period, from 12,601 units in 2020 to 26,735 units in 2024. During the interval, the Lifestyle segment added 81,040 units—43,471 of which were delivered in 2023 and 2024—followed by fully affordable (10,578 units) and RBN (3,401 units).
Atlanta averaged 546 days under construction for RBN properties, leading all metros in this ranking and seconded by Washington, D.C. (555 days). Completion of fully affordable projects averaged 636 days, outperforming metros like Miami, Dallas and Austin. Although Lifestyle took the longest of all asset classes to build in Atlanta, the metro ranked fifth by shortest delivery time, on par with Columbus and behind metros including Portland, Orlando and Indianapolis.
9. Los Angeles
Los Angeles ranked ninth with 29,692 units under construction as of April, surpassing Houston by 342 units. Development of fully affordable properties accounted for 28 percent of the pipeline, higher than the other metros in this ranking, but Lifestyle still took the largest share (68 percent) while RBN remained low, at 3 percent.
Between 2020 and 2024, Los Angeles deliveries totaled 60,821 units. The metro’s best years in deliveries were 2024 (14,989 units) and 2021 (12,914 units). The fully affordable segment added 12,600 units during the five-year period. Meanwhile, Lifestyle added 45,937 units, surpassing the 10,000-unit per year threshold in 2020, 2021 and 2023. RBN maintained a steady and slow growth during the period, up by only 2,284 units, 802 of which were delivered in 2024.
With 755 days under construction on average for fully affordable properties, the segment took the least to build among the other asset classes in Los Angeles but ranked fourth longest among Yardi Matrix’s top 30 metros. It ranked fifth longest for RBN days-under-construction with 874 days, outperforming entries including Austin, Detroit, New York and Phoenix. Construction time was the second longest for Lifestyle projects with 943 days, surpassing only Detroit (986 days).
10. Houston
Houston had 29,350 units underway as of April. Right in line with the national trend, 83 percent of its rental pipeline consisted of Lifestyle units. The fully affordable segment accounted for 14 percent, and RBN for just 3 percent.
Houston’s multifamily inventory gained 100,923 units between 2020 and 2024, plus an additional 4,681 in 2025 through April. The Lifestyle inventory added 92,950 units during the five-year frame, with the largest annual delivery volume in 2021 (22,157 units). Meanwhile, fully affordable and RBN struggled, up by 4,240 and 3,733 units, respectively, and both recorded minimal growth (84 and 75 units) in 2021.
Fully affordable properties in Houston averaged 652 days under construction, outperforming the other two Texas metros in this ranking. Lifestyle projects averaged 736 days under construction. Meanwhile, RBN properties took the longest to build, averaging 862 days under construction, which placed Houston seventh by longest average construction time, outperforming Austin and lagging behind Dallas.