Top 10 Multifamily Markets by Sales Volume in 2022 H1
Gateway markets rebound, regaining top positions in the multifamily sales volume landscape.
 The U.S. multifamily market had an exceptional performance from an investment standpoint during the first half of the year, according to Yardi Matrix data. Overall national multifamily sales volume surpassed $101 billion in the first six months of 2022, outperforming the $67 billion volume registered in 2021 during the same interval, while the average price per unit rose 28.4 percent year-over-year, to a new high of $218,377. The number of assets that traded also increased, from 2,362 properties during the first half of 2021 to 2,961 in 2022.
In the ranking below we’re looking at the top 10 markets by multifamily investment volume. Combined, their sales volume amounts to $48 billion, which accounts for nearly half of national sales activity. Notable highlights include a strong rebound of gateway markets New York and Los Angeles, not present in last year’s overall ranking, replacing Tampa and Raleigh.
| Metro | Sales Volume $ H1 2022 | Price Per Unit H1 2022 | PPU Evolution YoY | Units Sold H1 2022 |
| Phoenix | $7,351,109,167 | $339,622 | 58.3% | 24,787 |
| Atlanta | $7,012,412,048 | $204,312 | 27.0% | 39,113 |
| Dallas | $6,568,096,859 | $186,049 | 22.7% | 64,213 |
| Houston | $6,401,791,606 | $155,780 | 25.6% | 56,895 |
| New York | $3,997,523,782 | $642,482 | -7.8% | 7,524 |
| Orlando | $3,827,154,801 | $253,975 | 32.6% | 16,222 |
| Los Angeles | $3,714,402,840 | $444,200 | 17.9% | 8,812 |
| Miami | $3,581,485,100 | $350,816 | 43.6% | 14,701 |
| Washington, D.C. | $2,647,298,705 | $276,249 | 6.5% | 11,944 |
| Denver | $2,621,243,333 | $340,687 | 14.2% | 10,635 |
READ ALSO: Top 10 Multifamily Markets by Sales Volume in 2021
1. Phoenix

Phoenix. Image by Evgeni Tcherkasski via Pixabay
Phoenix was one of the first markets to recover all the jobs lost during the pandemic, entering the expansion phase late last year. Its multifamily investment volume rose to $7.4 billion during the first half of the year, a substantial increase from the $5.1 billion registered during the same time last year. However, last year, investor activity increased progressively from quarter to quarter, a dynamic that is more likely to be reversed in 2022 due to the current economic woes. Through June 2022, 127 properties (24,787 units) changed hands in the metro, slightly above last year’s correspondent period (124 properties, 24,115 units).
The average price per unit in Phoenix marked a 58.3 percent year-over-year increase, the largest of all metros in this ranking, to $339,622, well above the U.S. figure. By asset class, the per-unit price for upscale apartments stood at $472,452 in June (up 20.2 percent from the first quarter), while for the working-class units rose to $289,057 (up 15.1 percent from the first quarter). Considering the sales composition—which comprised 14,735 Renter-by-Necessity(RBN) units and just 10,052 Lifestyle units—investor competition was the main driver behind the price.
Last year, total multifamily sales volume in Phoenix amounted to $14 billion, which placed it third among major metros in the country.
2. Atlanta

Atlanta. Image by ericstokley via Pixabay.com
Atlanta’s balanced economy helped it reach expansion mode, too, keeping investors drawn to its multifamily market. Multifamily investment volume rose to $7 billion during the first six months of 2022, outperforming the $5.1 billion recorded during the same interval last year. Like Phoenix, investor activity increased progressively last year, rising to as high as $6.5 billion in the final quarter. Going forward, rising interest rates will likely dampen investment. Through June, 156 properties (39,113 units) traded in Atlanta, slightly above the number registered last year during the same period (139 properties, 34,355 units).
The average price per unit rose 27 percent year-over-year through June, a solid growth rate outperformed by Phoenix, Orlando and Miami in this ranking. At $204,312, the metro’s average is behind the national rate. By asset class, rent growth from 2022’s first quarter to the second was slightly tilted in favor of Lifestyle units: Lifestyle prices rose 15.5 percent to $267,820 per unit, while RBN prices rose 10.1 percent to $161,062 per unit. Looking at the sales composition, investors showed preference for upscale assets, which contributed to the increase in the average per-unit price—22,123 Lifestyle units and 16,990 RBN units.
Atlanta’s investment volume in 2021 rose to $14.5 billion, which placed it second among major markets in the U.S.
3. Dallas

Dallas – Ft. Worth. Image by Tim Urban from Pixabay
Last year’s leading metro, with $14.6 million in multifamily sales, continued to grow through strong in-migration and company relocations and expansions. The multifamily sales volume through June 2022 neared $6.6 billion, outperforming the nearly $5.2 billion volume of last year’s corresponding period. Here too investor confidence grew progressively last year, with the final quarter amounting to $5.1 billion. So far, transaction activity was much more intense compared with the same period last year, with 284 properties (64,213 units) changing hands through June, well above the 185 properties (49,544 units) that traded during the first half of 2021.
The average price per unit in Dallas is second lowest in this ranking, only trailed by Houston. At $186,049, the metro remains in the relatively affordable markets pool, behind the U.S. rate. Still, on a year-over-year basis, the rate rose 22.7 percent. The per-unit price for Lifestyle units rose 10.4 percent to $243,480, while RBN per-unit price rose 7.8 percent to $159,882. By sales composition, investors preferred value-add plays, with 33,693 RBN units and 30,520 Lifestyle units trading through June.

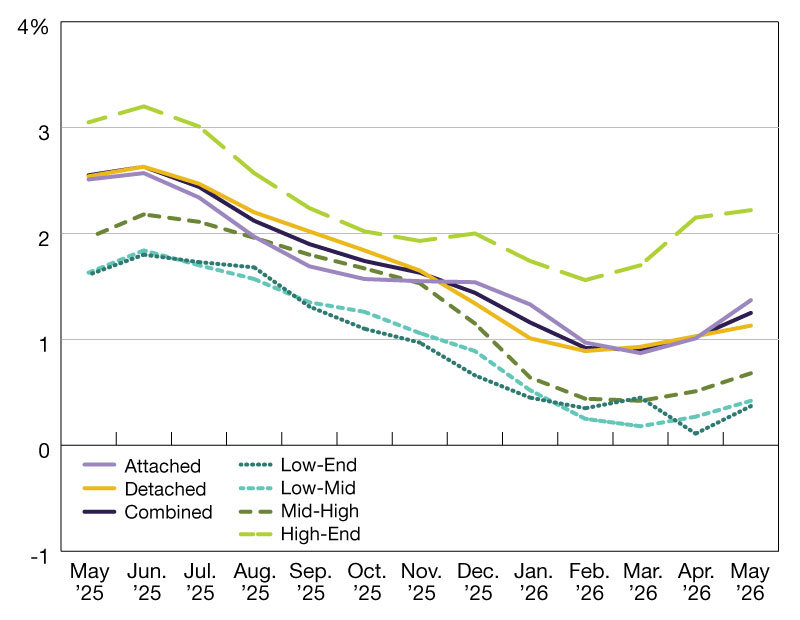
Chart created using Yardi Matrix data
4. Houston

Image by Falkenpost via Pixabay
The other Texas market in this ranking, Houston racked up $6.4 billion in multifamily trades during 2022’s first half, maintaining its ranking from last year ($11.1 billion through year-end). Compared with the same period last year, the energy market posted a substantial gain—just $2.6 billion in multifamily assets had changed hands during 2021’s first six months, but sales during the last quarter amounted to $4.9 billion. Through June, 221 properties (56,895 units) changed ownership, well above the 126 properties (30,245 units) that traded during the same period last year. Transaction activity will likely soften here as well for the remaining part of 2022.
The average price per unit in Houston rose 25.6 percent year-over-year through June, to $155,780, the lowest of all markets in this ranking, and well below the U.S. rate. Stronger demand for RBN apartments pushed the rate up 19 percent on a trailing three-month basis to $126,473 in June, while rent for Lifestyle units rose just 2.4 percent to $127,692. By sales composition, Lifestyle assets led in volume with 32,428 units, followed by the RBN segment (24,467 units).
5. New York

Image via Pixabay
A new entry in this ranking, New York’s multifamily sales volume rose to $4 billion. The market saw the strongest performance in this study when compared with the same period last year when just $933 million in multifamily assets were traded. Through June, 29 assets (7,524 units) changed hands, while last year only 12 properties (1,605 units) changed ownership.
New York is the only metro in this ranking that registered a decline in per-unit prices, down 7.8 percent year-over-year through June, but, at $642,482, it remains the most expansive market. The sustained economic recovery and the return of residents strengthened housing demand in 2022, with the average price per Lifestyle unit rising 4.2 percent from the first quarter to $811,132 in June. Meanwhile, the per-unit price for RBN units rose a hefty 63 percent on a T3 basis through June, to $326,730. Considering things from the sales composition perspective, in 2022 through June, demand for apartments has been stronger for upscale assets: 4,511 Lifestyle units and 3,013 RBN units.
6. Orlando

Image by Michelle Raponi via Pixabay
Orlando climbed two positions from last year’s ranking, with a total volume of $3.8 billion through June. Last year during the same period, investors had traded just $2 billion in multifamily assets. Specifically, through June, 54 properties (16,222 properties) traded, above the 50 properties (12,812 units) sold during the first half of 2021.
Based on the sales composition, investors heavily targeted luxury assets—10,724 Lifestyle units and 5,498 RBN units—which has contributed to a per-unit price gain of 32.6 percent year-over-year through June, to $253,975. The average price per Lifestyle unit stood at $313,586 in June (up 14.9 percent since the first quarter) and the average price per RBN unit clocked in at $172,882 (up 17.6 percent from Q1).
7. Los Angeles

Los Angeles. Image by Pedro Marroquin via Unsplash
The second newcomer in this ranking, also a gateway market, Los Angeles registered a $3.7 billion multifamily sales volume through June, well above the $2.1 billion amount recorded during the first half of 2021. The increase resulted from a higher number of traded assets—61 properties (8,812 units) during 2022’s first half from 48 properties (7,154 units) during 2021’s first half—but also from an increase in the average price per unit.
Specifically, the average price per unit in Los Angeles posted a 17.9 percent year-over-year gain, to $444,200 in June, which makes it the second most expensive market in this ranking, behind New York. By sales composition, investors were more drawn by RBN properties, which comprised 4,908 units, and the remaining 3,973 units were in Lifestyle assets. In June, the average price per RBN unit stood at $358,780 (up just 6.2 percent from Q1), while the Lifestyle unit sold for $631,186 on average (up a solid 27.8 percent from Q1).

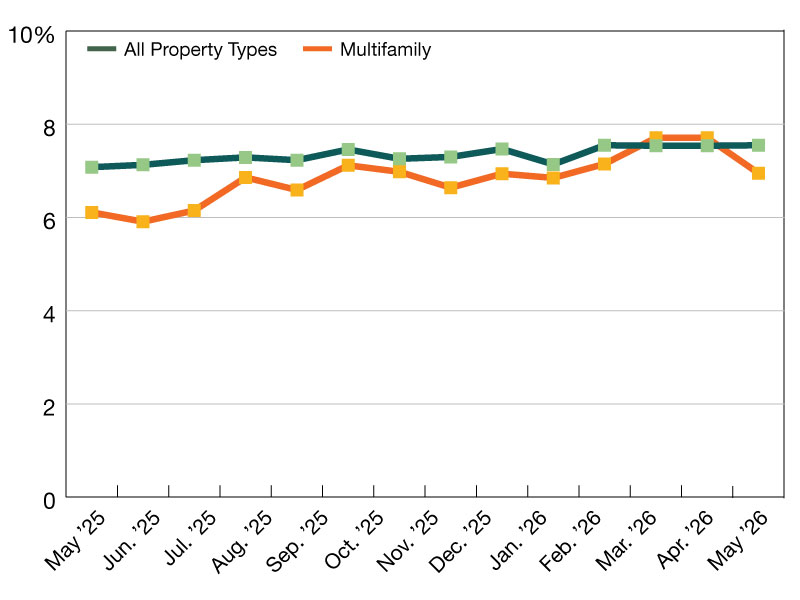
Chart created using Yardi Matrix data
8. Miami

Image by MustangJoe via Pixabay
The second Florida market in our ranking is down two positions from last year, with a sales volume of nearly $3.6 billion. Still, it is higher than the $2.7 billion volume recorded during 2021’s first half. In 2022 through June 60 properties changed hands, and last year through June 59, with the more visible difference in the number of units—14,701 units in 2022 and 13,993 units in 2021.
The average price per unit marked a substantial 43.6 percent year-over-year hike, outperformed only by Phoenix. At $350,816, the per-unit price places the metro behind only New York and Los Angeles. The sales composition contributed to the price increase: 9,515 Lifestyle units and 5,186 RBN units. The average price per unit in the Lifestyle segment stood at $452,164 in June (up 18.1 percent from the Q1 average) and in the RBN segment, it clocked in at $251,123 (up 23.3 percent from Q1).
9. Washington, D.C.

Washington, D.C. Image by David Mark via Pixabay
The District also lost two positions from last year’s total, with a multifamily sales volume of $2.6 billion, below the $3 billion volume recorded during the same interval last year. Although by the number of properties that changed hands the metro posted an increase (up to 53 assets from 44 a year ago), by number of units, the volume decreased to 11,944 units in 2022 from 13,091 in 2021 through June.
The average price per unit in the metro rose 6.5 percent year-over-year to $276,249 in June. Sales composition illustrates higher demand for value-add plays (7,004 RBN units) compared with 4,940 Lifestyle units. This dynamic is mirrored in the per-unit price performance by asset class—in the Lifestyle segment, the average declined 14.6 percent in June from the first quarter, while in the RBN segment it rose 14.4 percent, to $235,082.
10. Denver

Denver. Image by Andrew Coop via Unsplash
Down four positions from the 2021 ranking, Denver’s multifamily sales volume closes the ranking with a total of $2.6 billion during the first six months of 2022, behind the $3 billion volume registered during the same period last year. Although the metro recovered almost all jobs lost during the health crisis, its investment landscape is more susceptible to inflation and the tightening monetary policy on the federal level. Through June, 48 assets (10,635 units) changed hands, while last year 51 properties traded, which combined had 12,745 units.
The average price per unit rose 14.2 percent year-over-year, to $340,687 in June, trailing Miami, Los Angeles and New York in this ranking. Here too investors preferred value-add opportunities, with 7,004 RBN units and 4,940 Lifestyle units sold through June.
Yardi Matrix covers all multifamily properties of 50-plus units across 140 markets in the United States. This ranking reflects transactions within that sample group.