Top 10 Most Frequently Traded Multifamily Assets of the Past Decade
These rental properties changed hands more often than any in the U.S., according to Yardi Matrix data.

Image by Patrice Audet via Pixabay
The multifamily industry continued to see strong performance across fundamentals at the end of the first quarter of 2022, spurred by extraordinary demand. The kind of demand that transformed the market, pushing asking rents and occupancy to new historic highs in 2021. This incredible growth was largely driven by smaller, secondary metros, which during the pandemic became magnets for people leaving large, densely populated coastal areas. Working from home opened the door to residences with more square footage, at more affordable prices and in preferable climates.
Expectedly, investment activity marked all-time highs last year, in several metros, Yardi Matrix data shows, with Dallas, Atlanta and Phoenix each surpassing the $14 billion mark. This inspired us to search and find out which multifamily assets posted the highest frequency of sale during the past decade.
We dug through a property pool of more than 83,000 multifamily communities, and the results gave us a historical view of the multifamily investment market between 2012 and 2021.
The findings sparked a debate between those who are certain that we’re experiencing the strain of the middle-class renter and those who ask the question we’ve heard in the recent months: Are we in a bubble?
Key takeaways
Multifamily performance and investor demand for stabilized dividend-rich assets has pushed property sales and prices to new highs. A deep dive into repeat sales using Yardi Matrix’s database shows that from a total of 83,605 properties nationally, two assets hold the highest sales counts, each having changed ownership seven times between 2012 and 2021.
Moreover, a whopping 4,500 multifamily properties in the U.S.—more than 5 percent of total inventory—traded at least three times over the last decade: Nine properties were sold six times during the period, 58 properties traded five times, 463 properties changed hands four times, and 2,600 assets traded three times during the interval.
Looking at the top 10 assets in this ranking we noticed another expected commonality: all are value-add opportunities—a great investment vehicle that leads to a higher and faster return of investment. The 10 properties were built between 1964 and 1986.
Furthermore, these 10 properties are located in markets where investors have been gravitating even before the pandemic, stable markets with moderate to high liquidity: Phoenix (three assets), Dallas-Fort Worth (three assets), Atlanta (three assets) and Winston-Salem-Greensboro, N.C. (one asset).
| Market | Property Name | Number of Units | Property Address | State | Number of Sales | Year built |
| Phoenix | Urban 128 | 124 | 8818 South Central Avenue | AZ | 7 | 1986 |
| Atlanta | The Pines of Southlake | 93 | 985 Mt. Zion Road | GA | 7 | 1972 |
| Phoenix | S&T Plaza | 72 | 2130 West Indian School Road | AZ | 6 | 1982 |
| Phoenix | Regency 59 | 58 | 4512 North Black Canyon Hwy | AZ | 6 | 1964 |
| Atlanta | Brookstone at Brookhaven | 158 | 1322 Briarwood Road NE | GA | 6 | 1970 |
| Atlanta | The Broadway at East Atlanta | 176 | 1930 Flat Shoals Road SE | GA | 6 | 1966 |
| Dallas-North | Oak Creek | 109 | 2710 West Walnut Street | TX | 6 | 1964 |
| Fort Worth | Chaparral | 135 | 6520 Red Sierra Drive | TX | 6 | 1969 |
| Fort Worth | Copper Creek II | 236 | 5925 Callaston Lane | TX | 6 | 1979 |
| Winston-Salem – Greensboro | Hunters Point | 204 | 2231 Shadow Valley Road | NC | 6 | 1974 |
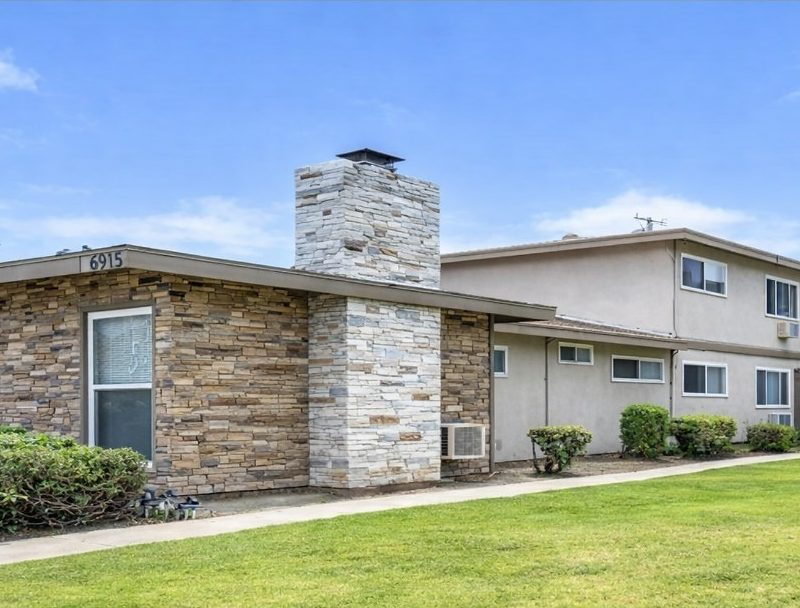
Urban 128

Urban 128, Phoenix
The 124-unit property is located on a 2.9-acre site at 8818 South Central Ave. in South Phoenix and was built in 1986. It’s a two-building property with a unit mix that comprises 10 325-square-foot studios of 325 square feet, 104 one-bedroom apartments (475 square feet) and 10 two-bedroom units (625 and 775 square feet).
The asset traded seven times between 2012 and 2021, with the most recent sale dating to 2019, when Thomas Pride International acquired the asset for $8.7 million, or $70,363 per unit, from a private investor. The transaction was subject to a $6.7 million CMBS loan with a 4.98 percent fixed interest rate and due in April 2029. The previous owner held it for three years after having spent $41,935 per unit in 2016; this shows that Urban 128’s value increased by nearly 70 percent over three years.
Looking back, the sale price from the 2012 sale was of nearly $1.6 million, or $12,548 per unit, paid by PTE Real Estate Group. Considering the sale prices, this property’s value increased by 461 percent over seven years, between 2012 and 2019.
The occupancy rate stood at 99.3 percent in 2018, dipped slightly below 80 percent during 2019 and 2020, and bounced back above 90 percent in 2021, clocking in at 96.8 percent at the start of 2022. The two-year drop in the occupancy rate is likely to be attributed to renovations. The property’s average asking rent rose 6.3 percent between 2019 and 2020, then marked a substantial 61.6 percent increase in 2021, while another 24.4 percent jump was recorded in 2022.
The Pines of Southlake

The Pines of Southlake, Atlanta
The 93-unit asset is located on a 8.5-acre lot at 985 Mt. Zion Road, in suburban Atlanta. The 34-building property was built in 1972 and consists of 30 two-bedroom apartments of 1,153 square feet, 23 two-bedroom/townhouse units of 1,091 square feet and 40 three-bedroom apartments (1,223 square feet).
The Pines of Southlake also changed hands seven times during the decade ending in 2021. Currently it is owned by RW Equities, which acquired it in 2021 from Crown Bay Group for $10.5 million, or $112,903 per unit, with aid from a $9.45 million loan held by Harbor Group International and due in 2026. Crown Bay Group held it for just 14 months, during which time the sale price rose by a hefty 64 percent, as the per-unit price stood at $69,000 at the time of its 2020 purchase.
Going back to 2012, the data shows that this asset was one of the recession-impacted properties, as it was the subject of a foreclosure on a CMBS loan placed in 2004 in the original principal amount of $3.5 million. At foreclosure, the property was sold for $1.45 million into a partnership with Wells Fargo Bank, which sold it soon after to a private investor for $1.2 million, or $12,887 per unit. The recession of 2008 caused this property’s value to drop 35 percent compared with the value it had in 1996, when DEL Development acquired it for $19,731 per unit. Since 2012, the property rebounded well, its value rising by 472 percent.
In 2018, occupancy stood at 96 percent and dropped 190 basis points in 2019; in 2020 it rose back up above the 96.5 percent, increased to as high as 97.2 percent in 2021 and slightly slid again to 95.7 percent this past January. Meanwhile, the average asking rent was on a constant upward trend, rising 60.6 percent over the three years between 2018 and 2021.
S&T Plaza

S&T Plaza, Phoenix
The 72-unit community occupies 1.5 acres in an Opportunity Zone at 2130 West Indian School Road, in Phoenix, Ariz. Built in 1982, the three-building property has 18 one-bedroom units of 610 square feet and 54 two-bedroom apartments of 710 square feet.
S&T Plaza changed ownership six times since 2012 and is currently owned by a private investor who acquired it in 2019 for $8.3 million, or $115,278 per unit, with aid from a CMBS loan in the amount of $6.5 million originated by Pinnacle Financial Partners, and due in October 2039. The previous owner—also a private investor—had acquired it in 2018 (17 months prior) for $3.85 million, or $53,472 per unit, which indicates to a property value rise of 115.4 percent.
The 2008 economic crisis also affected this asset, with data indicating a mortgage default in 2010. Moreover, the 2012 sale was a double escrow, completed on the same day—the property sold for $1.8 million, or $25,000 per unit, which shows a 51.6 percent depreciation from its pre-recession value. At the same time, compared with the 2019 transaction, S&T Plaza’s value rose by a solid 361 percent.
The occupancy rate has been fluctuating over the past years: from 80.1 percent in 2018 it rose to 91.1 percent in 2019, then dipped again to 84 percent in early 2020 and improved back to 92.3 in mid-2021. In January 2022, the rate clocked in at 87.5 percent. This instability in the occupancy rate likely points to a phased renovation, several units at a time. The performance of the average asking rent supports this scenario as since 2018, the asset’s average rent has increased 61.7 percent.
Regency 59

Regency 59, Phoenix
The third and final Phoenix asset in our top 10, this 58-unit property sits on a 1.6-acre lot at 4512 North Black Canyon Hwy. It comprises 14 buildings built in 1964, with a unit mix consisting of 30 studios of 555 square feet and 28 one-bedroom apartments of 695 square feet.
Regency 59—as well as all the remaining properties in this ranking—changed hands six times between 2012 and 2021. Most recently, the asset was acquired in 2021 by a private investor for $4.7 million, or $80,460 per unit, with aid from a $3.5 million loan funded by FirstBank. The previous owner had acquired it in 2019 for $2.6 million, or $44,828 per unit, which points to a 79.5 percent increase in the property value over two years.
In 2012, the property traded three times, for an average price of $700,000, or roughly $12,069 per unit. Compared to the property valuation in 2021, Regency 59 posted a 567 percent increase in value.
The occupancy rate has been relatively flat since 2018 onward, hovering around the 64 percent mark; in early 2022, the rate stood at 63.8 percent. The low occupancy is likely to be attributed to the property’s location close to the highway. However, despite low occupancy, the average asking rate increased gradually during the interval—by 52.7 percent between 2018 and 2022.
Brookstone at Brookhaven

Brookstone at Brookhaven, Atlanta
Spread across 10.7 acres at 1322 Briarwood Road NE in Atlanta, this 12-building, 158-unit property was built in 1970. Its unit mix comprises 23 one-bedroom apartments (980 square feet), 112 two-bedroom units (1,200 square feet) and 23 three-bedroom units (1,400 square feet).
In 2021, Sabra Associates acquired Brookstone at Brookhaven from a private investor for $46.7 million, or $295,359 per unit with aid from a $35 million loan held by Tilden Park Capital, due in 2024. The property’s value nearly doubled between 2019 and 2021, and marked an astounding 884 percent appreciation since 2012.
The occupancy rate stood at 94.9 percent in 2018 and entered a downward trend in mid-2019 attributed by management to renovations. In early 2022, the rate was still below the 30 percent mark. Ongoing renovations have impacted the average asking rent at the property, which rose only 8.2 percent since 2018.
The Broadway at East Atlanta

The Broadway at East Atlanta
This 22-building, 176-unit property occupies more than 15 acres in an Opportunity Zone at 1930 Flat Shoals Road SE in Atlanta. Built in 1966, the community comprises 88 one-bedroom units (725 square feet), 40 two-bedroom units (900 and 990 square feet) and 48 two-bedroom townhouses (1,250 and 1,365 square feet).
Most recently, the asset traded in 2021, when Fillmore Capital Partners acquired it for $24.1 million, or $137,074 per unit, from Liquid Capital, with the new owner assuming the outstanding balance of a $14.5 million CMBS loan held by Fannie Mae, originally dated in December 2017. The previous owner held it since December 2017, when it purchased it for $17.8 million, or $101,023 per unit. Based on these sale values, The Broadway at East Atlanta posted a price appreciation of 35.7 percent during the interval.
Going farther back to 2012, the asset was then foreclosed, because Tristar Real Estate Investments was unable to pay a $2.7 million loan held by Lone Star Funds. This led to the latter retaining the property as an asset. Some 15 months later, Lone Star Funds sold the property to a private investor for just $2.2 million, or $12,216 per unit, a 19.9 price reduction. Overall, the property’s value during the decade ending in 2021 increased by 799 percent.
Occupancy at The Broadway at East Atlanta has been relatively stable since 2018 onward: from 93 percent in 2018 it posted slight fluctuations—down to 90.0 percent in mid-2019, up to 95.2 percent in mid-2021. In early 2022, it slid to 89.2 percent. The average asking rent also posted a steady performance during the period, marking a 13.6 percent increase from 2018 to 2022.
Oak Creek

Oak Creek, Dallas
The 109-unit property is spread across 3.9 acres at 2710 West Walnut St. in north Dallas. Built in 1964, this four-building community has a unit mix comprising 16 one-bedroom units (668 and 825 square feet), 73 two-bedroom units (840 square feet) and 20 three-bedroom apartments (910 and 1,000 square feet).
With Texas being a non-disclosure state, the sale prices are estimates, but believed to be reasonably representative of the transfers.
Most recently, the property sold in 2021, when a private investor acquired it from Gomel Capital Partners for roughly $12.1 million, or $110,703 per unit, with aid from a $9.1 million loan held by Arbor Realty Trust. Gomel Capital Partners had held it for two years—it purchased it in 2019 for an estimated $8.1 million, or $74,153—which marks a 49.2 percent value increase over 24 months.
The March 2012 transaction—$1.5 million or $13,456 per unit—follows the foreclosure on November 2011, when Wells Fargo Bank retained it as an asset for a $2.5 million loan. Between 2012 and 2021, Oak Creek’s value rose by 723 percent.
In 2018, occupancy at the property stood at 93.9 percent and by mid-2020 it slid to 89.4 percent; it remained below the 90 percent mark throughout 2021 and in early 2022 (89.5 percent). The average asking rent rose steadily since 2018 onward, having risen 28.7 percent.
Chaparral

Chaparral, Fort Worth, Texas
The five-building, 135-unit property is located on a 4.6-acre site at 6520 Red Sierra Drive in Fort Worth, Texas. It was built in 1969 and consists of 47 one-bedroom units (696 square feet), 72 two-bedroom apartments (888 and 949 square feet) and 16 three-bedroom units (1,165 square feet).
Nitya Capital acquired it in 2021 as part of a portfolio transaction in a nine-property pack. The sale was subject to a $10.7 million loan, held by Bedrock Capital Associates. Previously, in 2017, the property sold for an estimated $8.1 million, or $60,059, while in early 2012, LNR Partners, acting as trustee oh behalf of Wells Fargo Bank, foreclosed on a CMBS loan placed in 2001 in the original amount of $4.6 million.
The occupancy rate dropped from 98.7 percent in 2018, to 85.2 percent in early 2022 and is attributed by the management to renovations. The average asking rent rose 17.3 percent between 2018 and 2022.
Copper Creek II

Copper Creek II, Fort Worth, Texas
Spread across 10 acres at 5925 Callaston Lane, Fort Worth, Texas, this 32-building, 236-unit property was built in 1979. Its unit mix consists of 36 studios (500 square feet), 112 one-bedroom units (661 and 740 square feet), 56 two-bedroom units (842 and 950 square feet) and 32 two-bedroom townhouses of 1,166 square feet.
In 2021, a private investor acquired it from Greenwater Investments for an estimated $22.8 million, or $96,751 per unit, with aid from a $17.1 million loan held by Arbor Realty Trust due in 2024. Greenwater Investments bought ownership of this property in mid-2019 for an estimated $13.2 million, or $55,932 per unit—which translates into a 73 percent increase in value.
In February 2012, Private Capital Group foreclosed on Bay Equity Real Estate and took ownership of the property—a loan in the amount of $5 million, held by California Bank and Trust, originally issued to Bay Equity Real Estate was acquired by Private Capital Group in October 2011. A month later, the property was sold again to a private investor, for an estimated $1.3 million or $5,650 per unit. Overall, the property’s value increased by an incredible 1612 percent between 2012 and 2021.
The occupancy rate stood at 92.6 percent in mid-2018; in the second part of 2019 it fell on a downward trend that hit the 76 percent bottom in mid-2020, when it started ascending again. In early 2022 it stood at 94.7 percent. Meanwhile the average asking rate at the property rose 39 percent since 2018.
Hunters Point

Hunters Point, N.C.
The seven-building, 204-unit property is located on a 16.7-acre site at 2231 Shadow Valley Road in High Point, N.C. and was built in 1974. The unit mix comprises 16 one-bedroom units of 673 square feet and 188 two-bedroom apartments ranging in size from 930 square feet to 972 square feet.
The most recent sale took place in 2019 and was a double escrow completed on the same day. The current owner is Geller Associates, which paid $11.6 million, or $56,863 per unit, with aid from a $9.4 million CMBS loan funded by Fannie Mae and due in 2034. In 2013, Arbor Realty Trust paid $4 million, or $19,608 per unit, for the asset, which translates into a 190 percent increase in value over six years.
The occupancy rate hovered below the 90 percent mark in 2018 (88.0 percent) and 2019 (87.1 percent) but climbed above the threshold in 2020 (93.8 percent) and 2021 (92.4 percent) and in early 2022 hiked up to 97.1 percent. The average asking rent had a slow but steady upward performance since 2018, recording an 8.4 percent appreciation over three years.