Top 10 Emerging Self Storage Markets of 2025
Our annual ranking of the nation’s fastest-rising metro areas, drawing on data from Yardi Matrix.
We are taking another look at the top emerging self storage markets in the U.S., taking into account their performance in 2024. Although national advertised asking rates had fallen 2.3 percent year-over-year as of December, the decline was less steep than the -3.5 percent average of the past year. Nationally, the annualized average rate per square foot settled at $16.28 for the combined mix of unit sizes and types. At the close of the past year, developers had 60.5 million net rentable square feet of storage space under construction, accounting for 3.1 percent of total stock. Based on a recent storage completions forecast, deliveries are anticipated to add 54 million square feet of storage space in 2025, followed by an additional 43 million square feet in 2026.
In the table below, we’ve listed the top ten emerging self storage markets in the U.S. Once again, there are several Florida metros making the list due to the state’s ongoing appeal. We ranked these smaller yet significant markets by looking at rent growth, development activity and demographic trends.
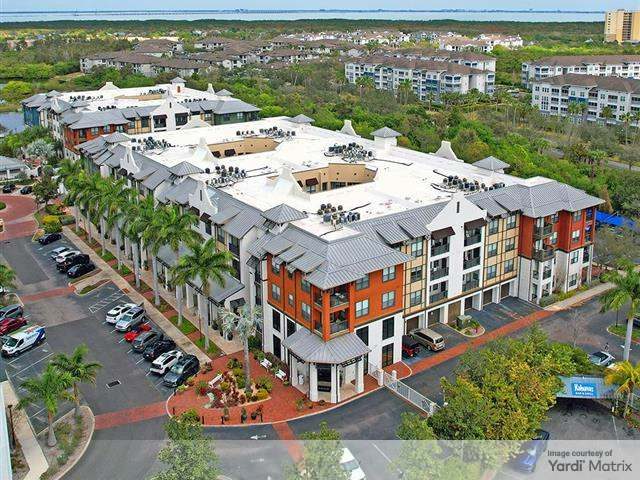
1. North Central Florida
North Central Florida's recent performance has made it the top emerging market. Ocala, Fla., a component of the metro, was the leading growth city on a recent 2024 U-Haul Growth Index, which looked at areas capturing substantial one-way U-Haul truck traffic over the past year. Port St. Lucie, Fla., was also on the list of cities, while Jacksonville, Fla., and Sarasota, Fla., made the top metro areas ranked by the REIT.
Among the various metros in the Sunshine State, North Central Florida ranked first on our list. With 12 million rentable square feet of total stock, the metro 9.8 net square feet available per person, above the national 7.6 average. Despite this, developers continue to be active across North Central Florida. As of December, the metro’s development pipeline included 13 projects totaling more than 1 million square feet underway, as well as 27 planned facilities encompassing nearly 2 million square feet. This new supply in various stages of construction amounted to 24.9 percent of existing inventory. Over the next five years North Central Florida’s stock is projected to grow by an additional 1.8 million square feet.
Regarding rates, the average annualized asking rate per square foot for the metro was $16.17 for the combined mix of unit sizes and types. The figure was slightly below the national average of $16.28 and marked a 2.2 percent annual drop.
2. Jacksonville, Fla.
In December, the metro’s unemployment rate was 3.0 percent, unchanged year-over-year, according to FloridaCommerce. During the past year, Jacksonville added 10,100 net jobs and led annual job gains for the trade, transportation and utilities sector, outpacing every other metro in the Sunshine State. Overall, Florida’s unemployment rate was 3.4 percent, well below the national average of 4.1 percent.
At the end of last year, Jacksonville's development pipeline included 28 planned projects totaling 24 million rentable square feet and 10 facilities underway covering 877,250 square feet. Overall, the pipeline accounted for 21.4 percent of the existing inventory. Over the next five years—2025 included—the metro’s self storage stock is projected to grow by an additional 1.9 million square feet. Jacksonville’s Jax Enterprise Permitting Inspections and Compliance System, or Jax EPICS, launched in January 2024 has already expedited the permitting process helping along all construction activity across the metro.
With an inventory of 15.1 million rentable square feet, Jacksonville offered residents 10.6 net square feet of available storage space per capita, leaving the national average of 7.6 square feet well behind. The average annualized asking rate per square foot for Jacksonville was $16.26 for the combined unit sizes and types, nearly on par with the national average of $16.28. Rent growth for the metro showed a 0.6 percent contraction year-over-year, not as steep as the 2.3 percent drop nationally.
3. Sarasota-Cape Coral, Fla.
Last April, The Cape Coral City Council once again imposed a temporary moratorium on new self storage facilities, set to end in April 2025. However, last October, the council opted to amend the land-development code and lift the moratorium. The new regulations require facilities to be at least one mile apart and 500 feet from a major intersection, among other restrictions.
Between 2020 and 2024, Sarasota-Cape Coral gained 6.9 million square feet of storage space. At 21.7 million square feet, the metro had the largest self storage footprint on our list. Despite Sarasota-Cape Coral having slightly over 11 net square feet of self storage space per capita, developers continued to expand. As of December, 22 developments totaling 1.9 million rentable square feet were under construction with an additional 76 projects encompassing 6.6 million rentable square feet in the planning stages. The pipeline accounted for 39.3 percent of existing inventory. Between 2025 and 2029, the metro is expected to gain an additional 6.3 million square feet of storage space.
As of December, Sarasota-Cape Coral’s average for advertised asking rates per square foot dropped to $15.71, marking a 4.9 percent decrease year-over-year. Nationally, the average same-store annualized rate per square foot settled at $16.28 for the combined mix of unit sizes and types, down 2.3 percent on an annual basis.
4. Tacoma, Wash.
As a more affordable alternative to nearby Seattle, the metro is a popular choice for commuters working in King County. That said, Tacoma, Wash., boasts a robust economy supported by key industries, such as logistics, healthcare, aerospace, technology along with banking and insurance.
As of December, Tacoma’s development pipeline included seven projects under construction totaling 500,049 rentable square feet and 17 facilities encompassing 1.2 million rentable square feet in the planning stages. The pipeline amounted to 13.5 percent of existing inventory. Based on a forecast, the metro will have gained an additional 1.6 million square feet of storage space by 2029. Overall, Tacoma had 12.5 million rentable square feet of storage space as of December. The total stock amounted to 8.8 net square feet per capita, above the national average of 7.6 net square feet per person.
Tacoma’s advertised street rate decreased to $17.82 in December, a 1.3 percent decline year-over-year. Nationally, the average advertised street rates per square foot for the combined mix of units for both climate-controlled and non-climate-controlled was $16.28, marking a 2.3 percent drop year-over-year.
5. Reno, Nev.
Reno's economy has always been driven by a vibrant tourism sector, however the metro’s other selling points are a resilient housing market and manufacturing, which is proving to be a key driver for economic growth. Lyten is planning to invest $1 billion to develop the world’s first lithium-sulfur battery gigafactory in Reno.
Reno saw significant growth with developers adding 1.4 million square feet of storage space between 2020 and 2024. At the end of last year, the metro had 10 million rentable square feet of storage space amounting to 16.4 net square feet per person, more than double than the national average of 7.6 net square feet per capita. Despite this, self storage developers across Reno had two facilities totaling 162,553 rentable square feet underway and 13 planned projects encompassing more than 1 million rentable square feet. The pipeline amounted to 12.1 percent of total stock. By 2029, Reno’s self storage footprint is expected to gain an additional 1 million square feet.
Regarding rates, Reno’s annualized asking rate per square foot for the main unit sizes and types was $16.13, just a touch below the national average of $16.28 as of December. Annual advertised rate growth for the metro was just a slight, 3 basis-point increase, however nationally rates were down 2.3 percent and were negative in most of the top metros tracked by Yardi Matrix.
6. Savannah-Hilton Head, Ga.
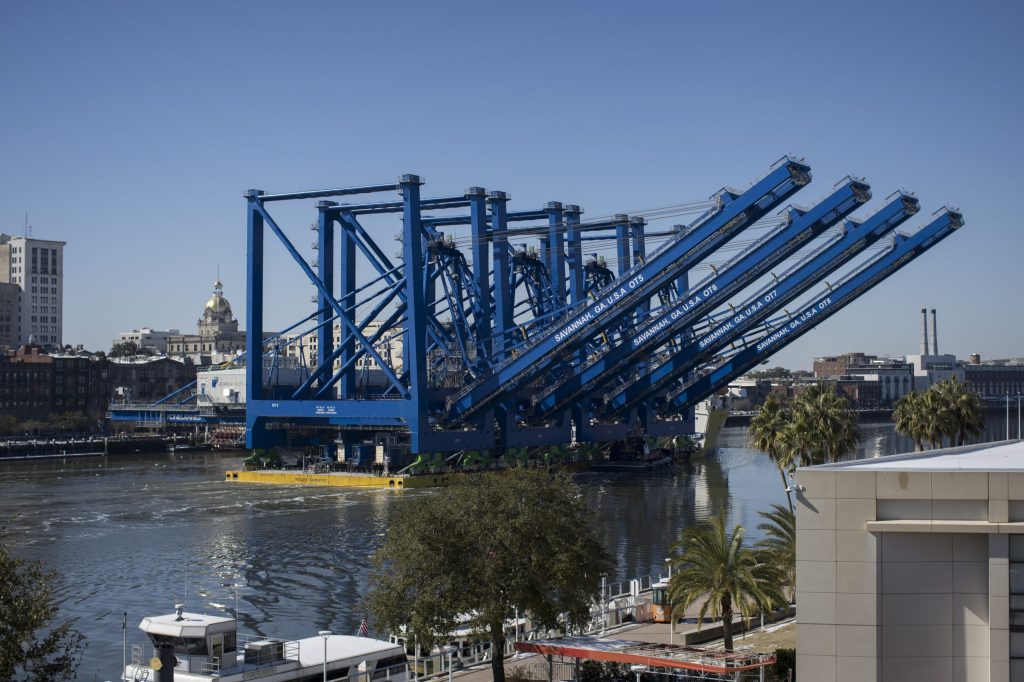
Savannah-Hilton Head has a diverse economy. The Port of Savannah processed more than 2.8 million twenty-foot equivalent units (TEUs) from July through December 2024, marking an 11.4 percent increase compared to the previous year, according to the Georgia Port Authority. Hyundai has begun producing electric SUVs at its EV Manufacturing Plant in Ellabell, Ga., less than two years after construction began on the $7.6 billion plant in 2022.
With 6.1 million rentable square feet of self storage space Savannah-Hilton Head had the smallest self storage footprint among the others on our list. Even so, the metro offered 10.6 net square feet net square feet of available storage space per capita, above the national 7.6 average. As of December, developers had seven facilities under construction totaling 544,124 square feet with an additional 12 planned projects encompassing 840,162 square feet. This new supply amounted to 22.7 percent of Savannah-Hilton Head’s existing inventory. Completions are estimated to add another 1.5 million rentable square feet of space by 2029.
Savannah-Hilton Head also saw a decline in rate growth. The average annualized asking rate per square foot fell to $16.79 for the combined mix of unit sizes and types. This marked a 3.8 percent decline year-over-year. Nationally, advertised rates were down 2.3 percent year-over-year shrinking to $16.28.
7. Boise, Idaho
Boise City, Idaho, came in tenth among large U.S. cities in the 2025 Best-Performing Cities list put together by The Milken Institute. The city earned its spot mainly due to the area’s steady job and wage growth recorded between 2018 and 2023.
With 12.4 million rentable square feet of storage space, Boise offered 16.2 net square feet available per capita, more than double the national average of 7.6 net square feet per person. As of December, the metro’s new development pipeline included two developments underway totaling 417,466 rentable square feet and 13 planned projects encompassing more than 1 million rentable square feet. The pipeline amounted to 11.7 percent of Boise’s total stock. Over the next five years, the metro’s inventory is expected to grow by an additional 1.5 million square feet.
The annualized average asking rate per square foot was $13.26 for the combined mix of unit sizes and types across Boise. This marked a 0.7 percent increase year-over-year, making the metro the top performer for rate growth on our list while also staying the most affordable. Nationally, advertised asking rates dropped to $16.28, down 2.3 percent year-over-year.
8. Nashville, Tenn.
Nashville, Tenn., is emerging as a business hub, illustrated by several companies' announced plans to move their headquarters there in 2024. Here are some of the notable companies making the move: tech giant Oracle, healthcare company Enjoin and e-commerce company Pink Lily.
Nashville's self storage footprint encompassed nearly 18 million square feet, providing residents with 9.6 square feet of storage space available per person. The metro had 14 projects under construction totaling 847,984 square feet with an additional 837,896 square feet across 13 facilities in the planning stages. These projects combined represented 9.4 percent of the existing inventory. Over the next five years, developers are expected to add another 1.3 million square feet of storage space.
The annualized average advertised asking rate was $15.40 per square foot for the usual mix of unit sizes and types, settling below the national $16.28 average. Overall, advertised asking rates for the metro saw a 2.5 percent decline year-over-year, more abrupt than the national 2.3 percent contraction.
9. Charleston, S.C.
At the state level, South Carolina topped the U-Haul Growth Index for the first time, followed by Texas, North Carolina, Florida and Tennessee. More than half of all U-Haul moves involving South Carolina this past year have been residents moving into the state.
Charleston’s 14.2 million rentable square feet of self storage stock translated to 12.3 net square feet per person. Despite having surpassed the national average of 7.6 net square feet per capita, construction activity in the metro remained strong. As of December, Charleston’s new development pipeline included two projects under construction totaling 230,762 rentable square feet as well as 14 planned projects encompassing 1.3 million rentable square feet. The pipeline amounted to 10.7 percent of existing inventory. By 2029, Charleston’s self storage stock is expected to grow by an additional 1.2 million square feet.
At $14.42, Charleston’s annualized average advertised asking rate per square foot for the combined mix of unit sizes and types was below the national $16.28 average. On an annual basis, advertised asking rates for the metro were down 4.5, nearly doubling the 2.3 percent national average.
10. Port St. Lucie, Fla.
Port St. Lucie saw significant economic growth in the past year, driven by population growth and rising investment interest in the area. Last May, BroadRange Logistics fully leased Interstate Crossroads Logistics Center in Fort Pierce, Fla. At the time, the 1 million-square-foot industrial lease was the largest industrial lease closed in Florida.
Port St. Lucie had a self storage footprint totaling 6.4 million rentable square feet, this way providing 9.5 net square feet of storage space available per capita, above the 7.6 national average. As of December, self storage developers across the metro had seven facilities underway totaling 472,741 rentable square feet and 22 planned projects encompassing 1.6 million rentable square feet. These developments came to 31.6 percent of existing inventory. Over the next five years, self storage developers are projected to add 1.4 million square feet of storage space.
The average annualized advertised asking rate per square foot in Port St. Lucie was $14.99 for a mix of unit sizes and types. The figure is below the national average of $16.28 and marked a 7.9 percent plummet year-over-year. This was the sharpest decline among the metros on our list.
Working with Yardi Matrix data, we filtered out all metros with 2 million or more residents, leading to a 105-strong metro list. Then, we decided on a series of significant data points that would separate the best-performing markets from the rest. We looked at the population growth rate within a 3-mile radius in 2022 utilizing U.S. Census data. Other data points included in this ranking are: Total completed rentable stock, year-over-year rent increases as of December 2024, completed inventory available per capita, projects under construction and in the planning phases as of December 2024, and forecast completions in the next five years. We then compared the 105 markets based on the performance of these data points and eventually assigned them a final score that indicates their position in our ranking.