Top 10 Emerging Multifamily Markets – Part II
The metros on this list saw their per-unit prices rise by as much as 95.1 percent while transaction activity was cooling across the country.
Following up on our list of top emerging multifamily markets, here’s a look at market fundamentals and performance for the first five of our top 10 markets smaller than 2 million residents.
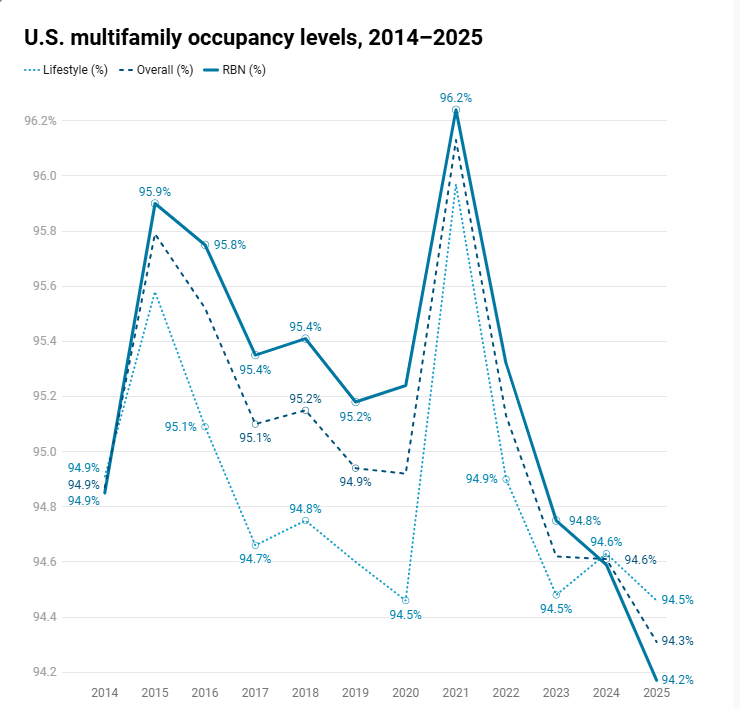
The national occupancy rate stood at 94.5 percent at the end of 2020’s third quarter, down 50 basis points year-over-year. The occupancy rates for the metros on this list ranged from 93.9 percent to 96.8 percent. Although transaction volume declined across the country last year, the per-unit prices in the 10 metros on this list, for sales closed through September, saw increases of as little as 9.3 percent (Omaha) and as much as 95.1 percent (Huntsville). Here is our full list of emerging multifamily markets.
| Rank | Market | Price per Unit | Units Completed | Units Under Construction | Unemployment Rate | Score |
| 1 | Huntsville | $118,127 | 274 | 3,351 | 5.1% | 22 |
| 2 | Pensacola | $175,971 | 1,249 | 2,994 | 4.5% | 27 |
| 3 | Colorado Springs | $185,019 | 760 | 2,911 | 5.9% | 29 |
| 4 | Omaha | $99,998 | 964 | 3,855 | 3.9% | 34 |
| 5 | Reno | $216,575 | 1,330 | 4,472 | 6.7% | 35 |
| 6 | Savannah-Hilton Head | $125,184 | 1,205 | 2,654 | 6.7% | 41 |
| 7 | Des Moines | $69,126 | – | 2,725 | 4.8% | 46 |
| 8 | New Orleans | $85,599 | 1,179 | 1,410 | 9.4% | 50 |
| 9 | Birmingham | $78,612 | 387 | 2,598 | 6.3% | 51 |
| 10 | Knoxville | $145,818 | 172 | 1,522 | 4.8% | 56 |
5. Reno, Nev.
Reno’s population rose 11.8 percent between the 2010 Census and July 2019, thanks in part to residents priced out of California relocating to this more affordable metro. The spillover effect positively impacted the average occupancy rate, which consistently surpassed the national average in recent years, standing at 95.7 percent in September 2020, 120 basis points above the nationwide rate. As a result of this increased demand, residential development activity in Reno skyrocketed over the past three years, when some 2,500 units came online, more than in the previous six years combined. Last year through September, developers completed 1,330 apartments, placing Reno first in delivery among markets on this list. Additionally, some 4,500 units were underway in September, making the metro stand out above the other markets on our radar for projects under construction.
Because Nevada classified construction as essential during its stay-at-home order back in late March and April 2020, the construction employment sector only lost 1,000 positions in the 12 months ending in September, equal to a 2.6 percent drop. In contrast, leisure and hospitality jobs were down 11.3 percent, or 4,900 positions. In total, the metro lost 14,200 jobs, amounting to a 4.9 percent decline. Meanwhile, its unemployment rate stood at 6.7 percent in September, on par with the national average.
4. Omaha, Neb.
Benefiting from positive employment and demographic trends, Omaha’s economy was expected to have a great year in 2020, but the COVID-19 outbreak brought a lot of uncertainty. However, the metro wasn’t as deeply impacted as other parts of the country. In September, Omaha had the lowest unemployment rate among all 32 markets on our radar, at 3.9 percent, 280 basis points below the national average and among the lowest in the country. Overall, the metro lost 14,100 positions in the 12 months ending in September, representing a 2 percent drop.
WIth Nebraska not restricting construction activity even during its initial 21-day stay-at-home order, developers completed six communities totaling more than 950 units year-to-date through September, with an additional 3,855 apartments underway. However, as the number of confirmed coronavirus cases continued to surge throughout October, the Harvard Global Health Institute included Nebraska on a list of 13 red-zone states, recommending a new stay-at-home order. One area where Omaha underperformed compared to the other metros on this list is in its per-unit price increase for sales closed in 2020 through September compared to the same period the previous year, with a jump of only 9.3 percent to almost $100,000.
3. Colorado Springs, Colo.

Colorado Springs, Colo. Image by Mosaic Outdoor Clubs of America via Wikimedia Commons
Overall, Colorado has seen a substantial uptick in demographic trends, with all metros reporting increases over the past decade. While the population growth of Colorado Springs wasn’t the strongest in the state between the 2010 Census and July 2019, it far surpassed the national average 6.3 percent growth rate by a factor of more than two, at 15.5 percent. As a result, Colorado Springs’ occupancy rate rose significantly in pre-pandemic quarters, including a 30-basis-point increase year-over-year through September 2020, to 95.4 percent, 90 basis points above the national average rate.
The metro’s employment market contracted by 5,400 positions in the 12 months ending in September, equal to a 1.8 percent drop. While the leisure and hospitality sector lost 5,900 jobs, other sectors reported significant gains—in total, professional and business services, construction and trade, and transportation and utilities added 5,400 positions. All in all, its unemployment rate stood at 5.9 percent, outperforming national average trends.
2. Pensacola, Fla.
In 2019, Pensacola consistently reported some of the highest increases in average multifamily rents, thanks to its robust employment market as well as a result of Hurricane Dorian. The metro’s population surged 11.9 percent from the 2010 Census to July 2019, with new residents moving in from elsewhere in the state as well as from Alabama and Texas. Developers took notice of this boom, and deliveries saw an upward trend in recent years, with 2,449 units completed between 2018 and 2019, more than the previous five years combined. In spite of the uptick in deliveries, the metro’s overall occupancy rate consistently surpassed the national average, although it saw a decline of 30 basis points year-over-year through September to 95.2 percent. And what’s more, nine communities totaling some 1,250 apartments reached completion year-to-date through September, the second-highest level among the markets on our list.
Pensacola lost 14,700 positions in the 12 months ending in September, equal to a 3.8 percent contraction. After reaching 11.8 percent in April, the market’s unemployment rate declined to 4.5 percent in September, a 130-basis-point increase year-over-year but still more than 200 basis points below the national average. And although the total sales volume declined by almost 50 percent year-to-date through September compared to the same period of last year to $190 million, the per-unit price rose by 32.5 percent to $175,971.
1. Huntsville, Ala.

Huntsville, Ala. Image by 12019 via Pixabay.com
In recent years, Huntsville has reported robust multifamily fundamentals, thanks to its diversified economy attracting a highly skilled workforce. In fact, its population rose 13 percent between the 2010 Census and July 2019, according to estimates, a rate far higher than any other metro in Alabama. As a result, pre-pandemic estimates anticipated Huntsville becoming the state’s largest city within this decade. It remains to be seen how these trends have been affected by the current crisis, but one thing is clear: Huntsville’s occupancy outperformed the national average by more than 200 basis points, standing at 96.8 percent in September 2020.
With positive demographic trends also came an increase in development activity over the past two years. Developers completed more than 1,100 units between 2018 and 2019, 44.8 percent more than during the previous two years. And while deliveries year-to-date through September were rather low, with only 274 units, the same cannot be said about transaction activity. The per-unit price for deals closed in 2020 through September rose 95 percent compared to the similar period of the previous year, while the total sales volume increased more than three times to $293.3 million. Its outstanding investment activity last year, coupled with a high number of units underway, placed the metro at the top of our list.
Working with Yardi Matrix data, we first filtered out all metros with 2 million residents or more, and we ended up with a list of 32. Then, we decided on a series of significant data points that would separate the best-performing markets from the rest. We looked at the increases in the average per-unit price for transactions closed in 2020 through September compared to the same period of the previous year, at how the employment market performed year-over-year, as well as the number of units completed over the first nine months and the number of apartments underway as of September. We then compared the 32 markets based on performance of these data points, and eventually assigned them a final score.