Quarterly Senior Housing Update
Senior housing enjoys consistently strong fundamentals as demand increases at historic levels.

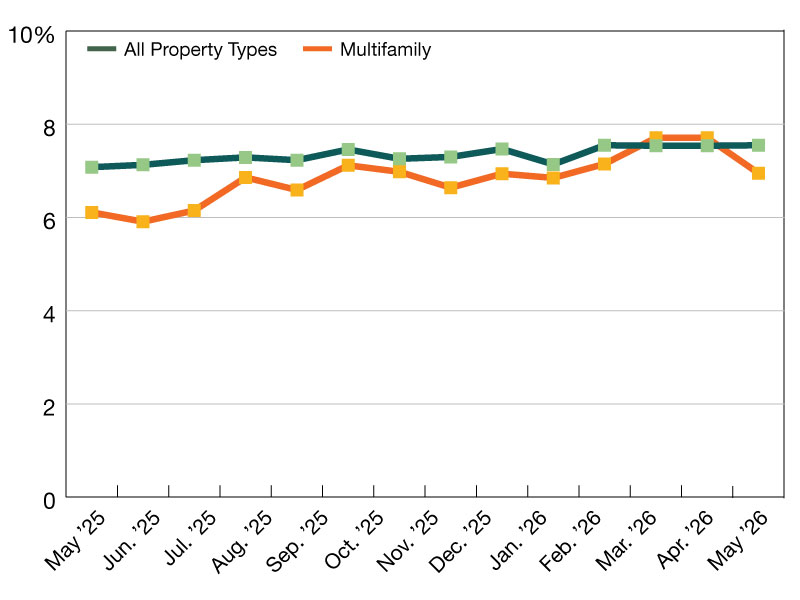
Senior housing occupancy continues its upward trajectory, reaching 86.5 percent in the third quarter of 2024, marking the 13th consecutive quarter of improvement. Remarkably, nine of the last 13 quarters have experienced the highest absorption volumes ever recorded in NIC MAP’s history.
In the third quarter of 2024, occupancy rose again to 86.5 percent, extending the streak to 13 consecutive quarters. Ten of the last 13 quarters have exceeded at least 4,500 senior housing units absorbed. That has only happened once prior in the history of NIC MAP. Furthermore, the number of occupied units has reached all-time highs, with a nearly 4 percent year-over-year increase compared to the third quarter of 2023.
The third quarter of the year also marked the 13th consecutive quarter where absorption outpaced inventory growth, fueling further occupancy gains across the sector. Absorption increased by 14 percent compared to the previous quarter, with three of the last five quarters resulting at least 6,000 units absorbed per quarter for an average of over 6,100 units absorbed. Comparatively, prior to 2020, there were only two quarters in the history of NIC MAP data that exceeded 5,000 units absorbed.
READ ALSO: Senior Housing Improves Slowly and Steadily
While new inventory growth in the second quarter ticked up slightly compared to the first three months of the year, no quarter in the past two years has seen more than 3,000 new operational units added in NIC MAP’s Primary Markets. Additionally, the number of senior housing units under construction in the second quarter was down 21 percent compared to last year.
Given the overall trend in new construction, the expectation is for units under construction to continue to decline in the coming quarters. Construction represented 3.8 percent of existing inventory in the second quarter, down from 4.8 percent a year prior. Historic inventory growth, both short and long term, are required to keep pace with current and anticipated demand.
The pace of new inventory growth declined in the third quarter, as inventory growth was down 27 percent compared to the previous quarter and down 37 percent compared to the third quarter of last year. Only two quarters over the last two years have exceeded over 3,000 units added in Primary Markets. By comparison, the eight quarters prior to 2020 averaged nearly 5,000 units added in Primary Markets per quarter. Additionally, the number of senior housing units currently under construction has declined eleven straight quarters, with this downward trend expected to persist.
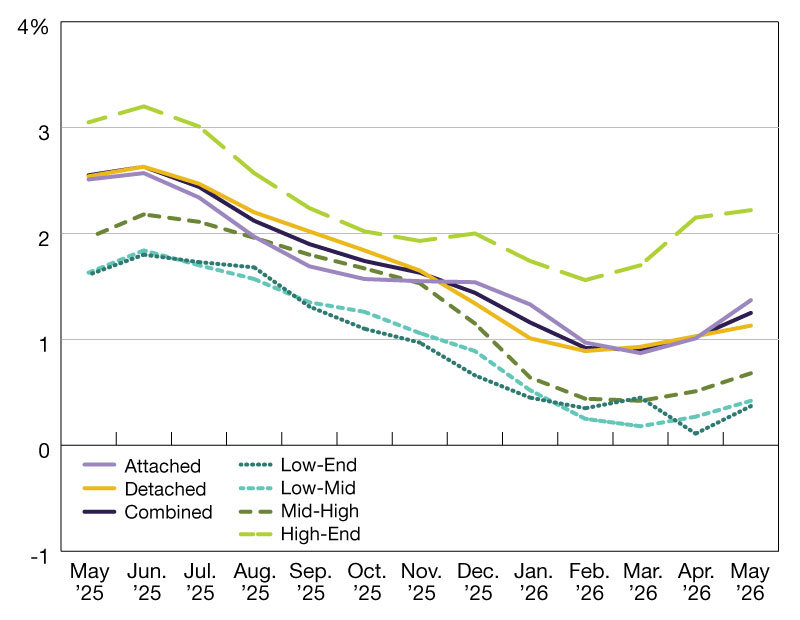
Rent change continues to decelerate
In line with decelerating inflation trends across the economy, the reported annual rent change, measured against the previous year, has continued to decelerate over the last five quarters from its all-time peak high in the second quarter of 2023.
The average asking rent for senior housing in the third quarter exceeded $5,380, the highest average rent in history. This is a 4.2 percent increase compared to the previous year, well exceeding headline inflation. After nine straight quarters of rate acceleration, we have now seen five consecutive quarters of deceleration from a 6.1 percent peak in the second quarter of 2023 to 4.2 percent this quarter.
As outlined in NIC MAP’s Senior Housing Market Outlook, the net effect of these trends, when paired with the explosive growth occurring in the 80+ population, position senior housing to be one of the best performing asset classes in commercial real estate. Senior housing enjoys incredibly strong fundamentals as demand increases at historic levels while supply growth remains constrained in the face of dislocated capital markets and elevated interest rates.
Commentary provided by Arick Morton, NIC MAP CEO
—Posted on October 30, 2024