National Affordable Housing Report – December 2024
How NOI, revenue and expenses are stacking up, according to the latest Yardi Matrix report.

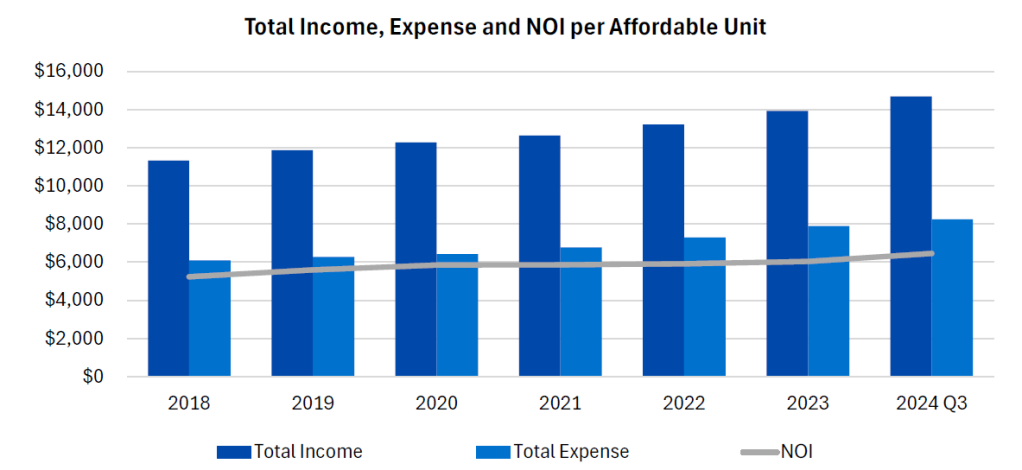
Revenue in the U.S. affordable housing sector has seen ups and downs as both expenses and incomes grew year-over-year through September, according to the latest Yardi Matrix Affordable Housing report. For the average affordable unit, expenses were up 6.4 percent while income climbed 7.2 percent.
In the affordable sector, thinner revenue margins are impacting the market more significantly than market-rate rental housing. For instance, 56.3 percent of the revenue encompasses expenses for the average affordable asset, while the figure is just 44.9 percent in the market-rate sector.
While costs were up, the figure seems to be moderating. The full-year growth for affordable housing expenses was 8.2 percent in 2023 and 7.7 percent the year before. Pre-pandemic costs were lower with an increase of 3.6 percent in 2018 and 3.2 percent in 2019.
Insurance and marketing expenses were the main driving factors behind the increase. Property insurance costs for affordable assets were up 20.3 percent year-over-year as of September. On the heels of a robust multifamily supply pipeline, the marketing costs rose 18.4 percent during the same period.
As major weather-related events become more frequent, claims for hurricanes, floods and wildfires are on the rise. The phenomenon affected a broad range of sectors and most notably, insurance costs overall were up 135.7 percent since 2018.
Year-over-year through September, the largest affordable insurance expense growths were registered in the Southeast (23.9 percent), the Southwest (22.3 percent) and the West (21.1 percent). A few metros witnessed monumental insurance spikes, such as Houston (41.5 percent), Charlotte, N.C., (39.4 percent) and Tampa, Fla. (34.3 percent).
HUD’s grip over maximum allowable rents softens
The affordable income is deeply entwined with the federal department of Housing and Urban Development’s maximum allowable rent formula. Each year, HUD sets a cap considering various factors including but not limited to inflation, wage growth and the area median income.
For 2024, HUD’s formula would have allowed for a 14 percent increase, however, the rate settled at 10 percent. Additionally, affordable rent increases may also be restricted by local jurisdictions and property owners.
The 7.2 percent income growth per-unit on a year-over-year basis more than doubled 2021’s figure (3.0 percent) and outpaced increases recorded in 2022 and 2023. Several metros stood out with double-digit income increases including Nashville, Tenn., (12.9 percent), San Antonio (12.0 percent) and San Diego (11.4 percent).
The expenses make up a large share of the income in Philadelphia (74.4 percent), Kansas City, Mo., (74.2 percent) and Indianapolis (70.7 percent). The markets where the affordable costs are less than half of income—ranging between 41.5 and 49.4 percent—are Los Angeles, Miami, Denver, San Diego, Seattle and Orlando, Fla.
Affordable housing net operating income more than quadruples year-over-year
With HUD’s formula allowing for higher-than-usual rent growth in 2024, the net operating income for affordable assets spiked by 8.1 percent in September, compared to the year prior.
Nine metros posted double-digit NOI growth for their affordable housing sectors. Among them were Nashville (25.0 percent), San Diego (20.2 percent) and Raleigh (19.8 percent). At the other end of the spectrum. On the opposite spectrum were several metros burdened by high expenses with negative NOI, such as Charlotte (-1.2 percent), Houston (-3.1 percent) and Pittsburgh, Pa. (-3.2 percent).
For this research, Yardi Matrix employed a data set of 6,443 affordable multifamily properties across 114 U.S. metros. An affordable asset is defined as a community in which at least 90 percent of units are designated as affordable.
Read the full Yardi Matrix affordable housing report.