Market Pulse for April 2016
Market Pulse section compiled by Suzann Silverman. To comment, email ssilverman@cpexecutive.com. Multifamily Starts: In January 2016, housing starts of buildings with five or more units fell. This is the second consecutive monthly decline. Over the month of January, housing starts of buildings with five or more units, measured at a seasonally adjusted annual rate, declined…
Market Pulse section compiled by Suzann Silverman. To comment, email ssilverman@cpexecutive.com.
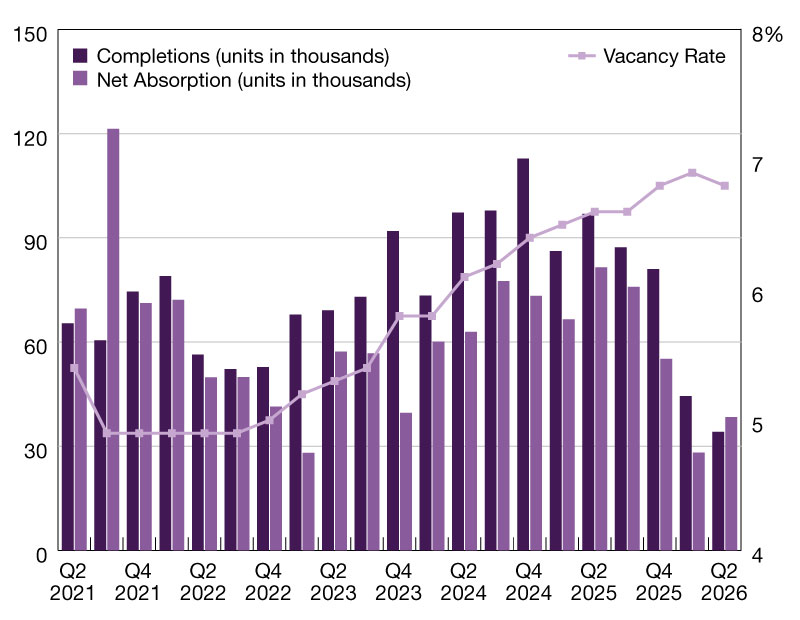
Multifamily Starts:
In January 2016, housing starts of buildings with five or more units fell. This is the second consecutive monthly decline. Over the month of January, housing starts of buildings with five or more units, measured at a seasonally adjusted annual rate, declined by 2.5 percent to 354,000. Over the past two months, these housing starts have decreased by 7.8 percent. Since reaching 455,000 units in September, housing starts of buildings with five or more units have averaged 361,000 over the months of October 2015 to January 2016. During the months from April 2015 to September 2015, housing starts of buildings with five or more units averaged 421,000 per month. However, this reversal was also present between the second quarter of 2014 and the first quarter of 2015. Between April and September of 2014, housing starts of buildings with five or more units averaged 353,000, but between October 2014 and March 2015, these starts averaged 332,000. Despite the fluctuation, housing starts of buildings with five or more units totaled 385,000 in 2015, 13 percent greater than its level in 2014, 342,000.
 CPI vs. Rent:
Consumer prices (CPI) overall, measured on a seasonally adjusted basis, were unchanged over the month of January 2016. However, stagnancy in the headline price index masked price changes in the individual components. Specifically, falling energy offset gains elsewhere. In January, energy prices declined by 2.8 percent. Meanwhile, food prices were unchanged over the month. Excluding the more volatile prices of energy and food, “core-CPI” rose by 0.3 percent over the month of January, 0.1 percentage point faster than its rate of growth in December 2015, 0.2 percent. Growth in core-CPI partly reflected an increase in shelter prices. Shelter prices, which account for the largest portion of consumer expenditures, rose by 0.3 percent in January, 0.1 percentage point faster than the 0.2 percent rate of monthly growth recorded in December. Rental prices, a component of overall shelter prices, grew by 0.3 percent over the month, eclipsing the 0.2 percent growth rate from December. Since the increase in rental prices matched the monthly rise in overall inflation, as measured by core-CPI, then NAHB’s Real Rent Index was unchanged over the month of January. Over the past year, the Real Rent Index is up by 1.5 percent.
Existing Condo Sales and Prices:
Existing condo and co-op sales, measured at a seasonally adjusted annual rate, fell by 4.7 percent over the month of January 2016 to 610,000. However, the monthly decline was confined to a 10.3 percent decrease in the pace of sales in the South region. Meanwhile, in the other three regions of the country, the Northeast, the Midwest, and the West, sales of existing condos and co-ops were unchanged over the month. While sales of existing condos and co-ops fell over the month, the inventory contracted even more. In January 2016, the inventory of existing condo and co-ops fell by 8.5 percent to 195,000. Since the pace of sales fell at smaller rate than the inventory of existing condos and co-ops, then the months’ supply, which represents the number of months it would take to exhaust the existing condo and co-op inventory at the current sales pace, also declined, falling by 5.0 percent over the month to 3.8 months. Median existing condo and co-op sales prices rose by 7.4 percent on a not seasonally adjusted basis over the past year to $203,900.
 Building Materials:
The price of inputs to construction fell by 1.3 percent on a not seasonally adjusted basis over the 12 months ending in January 2016. This component of the Producer Price Index is composed of the price of inputs to new construction and the price of maintenance and repairs. Over the past year, the price of inputs to new construction eased by 1.1 percent. The price of inputs to new non-residential construction fell by 1.8 percent while the price of inputs to new residential construction dropped 0.6 percent. Meanwhile, the price of maintenance and repairs construction fell by 1.7 percent over the past year. The price of inputs to non-residential maintenance and repairs decreased by 2.1 percent while the price of inputs to residential maintenance and repairs declined by 1.4 percent. Twelve-month changes in the prices of individual building materials varied. The price of cement rose by 5.6 percent and the price of oriented strand board (OSB) grew by 11.2 percent. However the price of softwood plywood declined by 14.8 percent and the price of gypsum decreased by 2.2 percent.

Commentary and data were supplied by Michael Neal, a senior economist with the National Association of Home Builders (NAHB).
Michael Neal is a senior economist with the National Association of Home Builders (NAHB). In this capacity, he monitors macroeconomic and financial issues that affect the U.S. and local housing markets. Prior to joining NAHB, he worked at the Joint Economic Committee of the U.S. Congress, the Federal Reserve, the Congressional Budget Office and Goldman, Sachs & Co.