How Opportunity Zones Progressed Through 2024
We just entered year six for OZs, so we asked a few specialists to delve into the program’s progress.
The 2017 tax reform brought the Opportunity Zones as a means of spurring economic growth and job creation in low-income communities across the U.S. After almost six years, have they reached their purpose? Also, are they really a profitable investment for multifamily players?
Those who invested before the end of 2019 would say “yes” as they got the full tax benefit. But at the end of that year, there was a 15 percent basis step-up that expired. Two years later, a 10 percent basis step-up expired. Through 2026, investors can still access this incentive and benefit from no capital gains taxation on the subsequent Opportunity Zone investment as long as they hold the investment for at least a decade.
Across the country, 8,764 areas were designated Opportunity Zones—to be eligible for nomination, a census tract had to either be a low-income community or contiguous to a low-income community. The IRS and the Treasury Department hold the information regarding the investment volume that has actually materialized over the past six years.
READ ALSO: Finding Solutions to the Workforce Housing Squeeze
“But only a limited number of summary statistics have been made publicly available. These were reported in a working paper published by two Treasury Department economists with data through the end of 2020,” Kenan Fikri, director for research at the Economic Innovation Group, told Multi-Housing News.
The paper does not report on a count of total projects, but it does report that 48 percent of designated OZs received investment through the incentive by the end of 2020, equating to around 3,800 census tracts. That’s up from 26 percent at the end of 2019, placing the growth rate in terms of the number of communities seeing investment on a steeply rising trajectory, noted Fikri.
Treasury also reported that investment funds raised $48 billion in direct OZ equity capital through the end of 2020. Quoting data from private source Novogradac, the EIG director shows that OZ fundraising rose rapidly from there, leading to the consensus estimate that total capital raised through the incentive now exceeds $100 billion.
“Note that Novogradac only captures a subset of the market. We think that they represent the trend accurately but only capture 25 to 33 percent of the full market,” he observed.
Factors deterring more OZ investments
To better understand how swiftly OZs have been integrated into the landscape, keep in mind that the New Markets Tax Credit took 18 years to reach a similar number of communities. While it is true that the tools for each legislation are structured differently—NMTCs are capped each year and OZs are designed to scale with demand—the OZ program was and continues to be a success story, with real estate investors greatly benefitting from it.
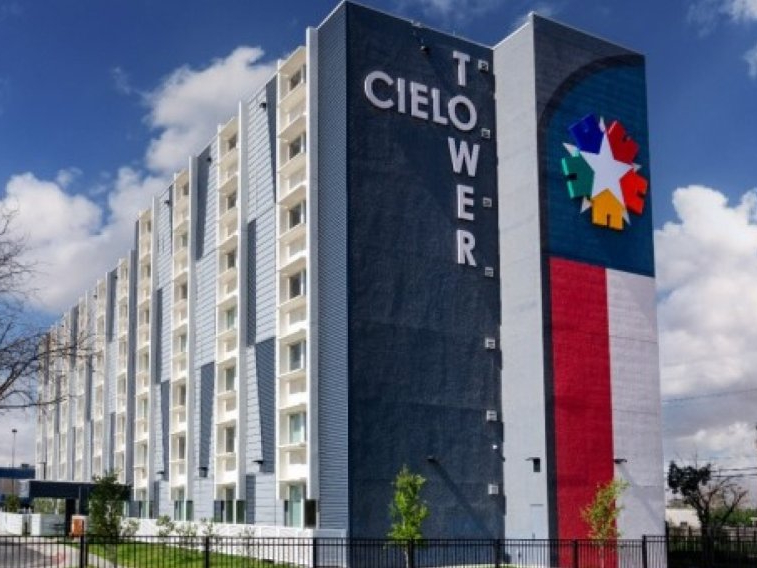
Paul Daneshrad, founder & CEO of StarPoint Properties, launched his company in 1990 and racked up more than $3 billion of transactions ever since. His firm started its OZ program in 2020 and currently has six assets in its portfolio. Among them, a 180,000-square-foot building in San Bernadino, Calif., recently sold to an institutional buyer, and a 280-unit multifamily project in Arizona, slated for completion in 2025.

In 2022, StarPoint Properties broke ground on Lotus Point in Mesa, Ariz. All images courtesy of StarPoint Properties 
The 280-unit apartment project is located in an Opportunity Zone. 
Lotus Point is taking shape at 139 N. Dobson Road near the corner of Main Street in Mesa. 
Plans also call for the construction of a swimming pool, fitness center, clubhouse and coworking facility. 
Completion is anticipated for 2025.
“The tax and public benefits are what attracted us to the program. It’s a generational opportunity when it comes to its public and private benefits,” Daneshrad said.
From his standpoint, construction costs and inflation are now the biggest hurdles to further growth of the Federal program. High interest rates have also changed the calculus, even though the capital gains forgiveness offered by OZs are still drawing investors, the specialists agree.
Fikri’s focus on data prompted him see the lack of information as the biggest obstacle in the way of a stronger program adoption. “Without full information on the location, scale and diversity of OZ investment, investors, policymakers, developers and community leaders only have partial views into how the incentive is being deployed and the effect it’s having on communities,” he noted. By design, the OZ incentive is market-based, and markets function best when information is rich and widely available.
“We know OZs are having a large and largely positive impact on investment in low-income communities nationwide, but it’s nearly guaranteed that we’d have more of it—and that it’d be even more impactful—if we knew more about how and where the incentive can work best,” Fikri said.
READ ALSO: OZ Development—Do Benefits Outweigh Current Challenges?
A bill introduced in Congress—the Opportunity Zones Transparency, Extension, and Improvement Act—would call for this data to be published, but there’s a lot the Treasury Department could make available on its own even without Congressional directives. For Michael Wiener, a tax law attorney and OZ specialist at Greenberg Glusker, state conformity is what slams the brakes on the program’s wider adoption, particularly in California.
“California does not conform to the Opportunity Zone tax benefits,” Wiener said. “This means that the Opportunity Zone tax benefits are only available with respect to federal income tax, but not with respect to California state income tax.”
So, if clients are initially enthusiastic about Opportunity Zone investments, they become less interested once they find out that they will not receive any California state tax benefits for their OZ investments.
Both the investor/developer and the tax attorney agree that the initiative is not easy to work with. Finding the right projects that meet the Federal guidelines can be challenging. Being able to absorb the higher costs for construction is also tough, especially when real estate values are dropping, Daneshrad admitted.
The highly technical format is not particularly intuitive, either, said Wiener. “The compliance and reporting requirements can be burdensome,” he added.

But despite all the hurdles, there were some areas across the country that really took advantage of the incentives provided by the program. Through the end of 2020, around three-quarters of OZs received investments utilizing the incentive in Colorado and Oregon, followed by Utah and Arizona, according to a map put together by the EIG using data from the Treasury Department. Western states all performed well, along with Vermont (60 percent of OZs), South Carolina (63 percent), Mississippi (64 percent) and South Dakota (68 percent).
“A mix of different factors help explain these patterns, including population growth and the many different approaches governors took to select the census tracts that would become OZs,” Fikri said. “We expect that investment penetration has caught up in many lagging states such as Illinois, Iowa and Alabama in more recent years.” he added.
Leading the multifamily development boom
Even though, more recently, clean energy made good strides in OZ investments as federal efforts intensified, supporting the sector, multifamily continues to be the preferred asset class for OZ investment due to the nationwide housing shortage, followed by mixed-use and commercial.
“OZs have been leading the multifamily development boom,” said Fikri.
The first, most immediate and most tangible way OZs have impacted the designated areas is the construction of new or substantially refurbished structures. Nationwide, the total number of new housing units in OZs has accelerated significantly since the incentive’s passage. The graphics below reflect growth rates in some states.


“OZs are expanding the supply of new housing sufficiently quickly that they appear to be having a stable or even downward impact on rents, easing early fears of resident displacement,” Fikri said. “The fact that by law OZ investments must be in new construction or substantial rehabilitation of existing ones helps ease these concerns, too,” he added.
The volume of housing deliveries is a meaningful measure of success and impact on the designated areas. Additionally, improvements have been reported in poverty rates, incomes and vacancy rates in designated tracts. And more positive momentum is expected as broader revitalization effects take hold and uplift the economic prospects of long-time residents.
More so, neighboring tracts are also experiencing positive economic and development spillovers, with OZs becoming local poles of growth and redevelopment, lifting broader neighborhoods, Fikri concluded.