Economy Watch: Investment in Real Estate Still Lags
The Bureau of Economic Analysis released the real estate-related components of the government’s latest estimate for U.S. GDP growth.
By Dees Stribling, Contributing Editor
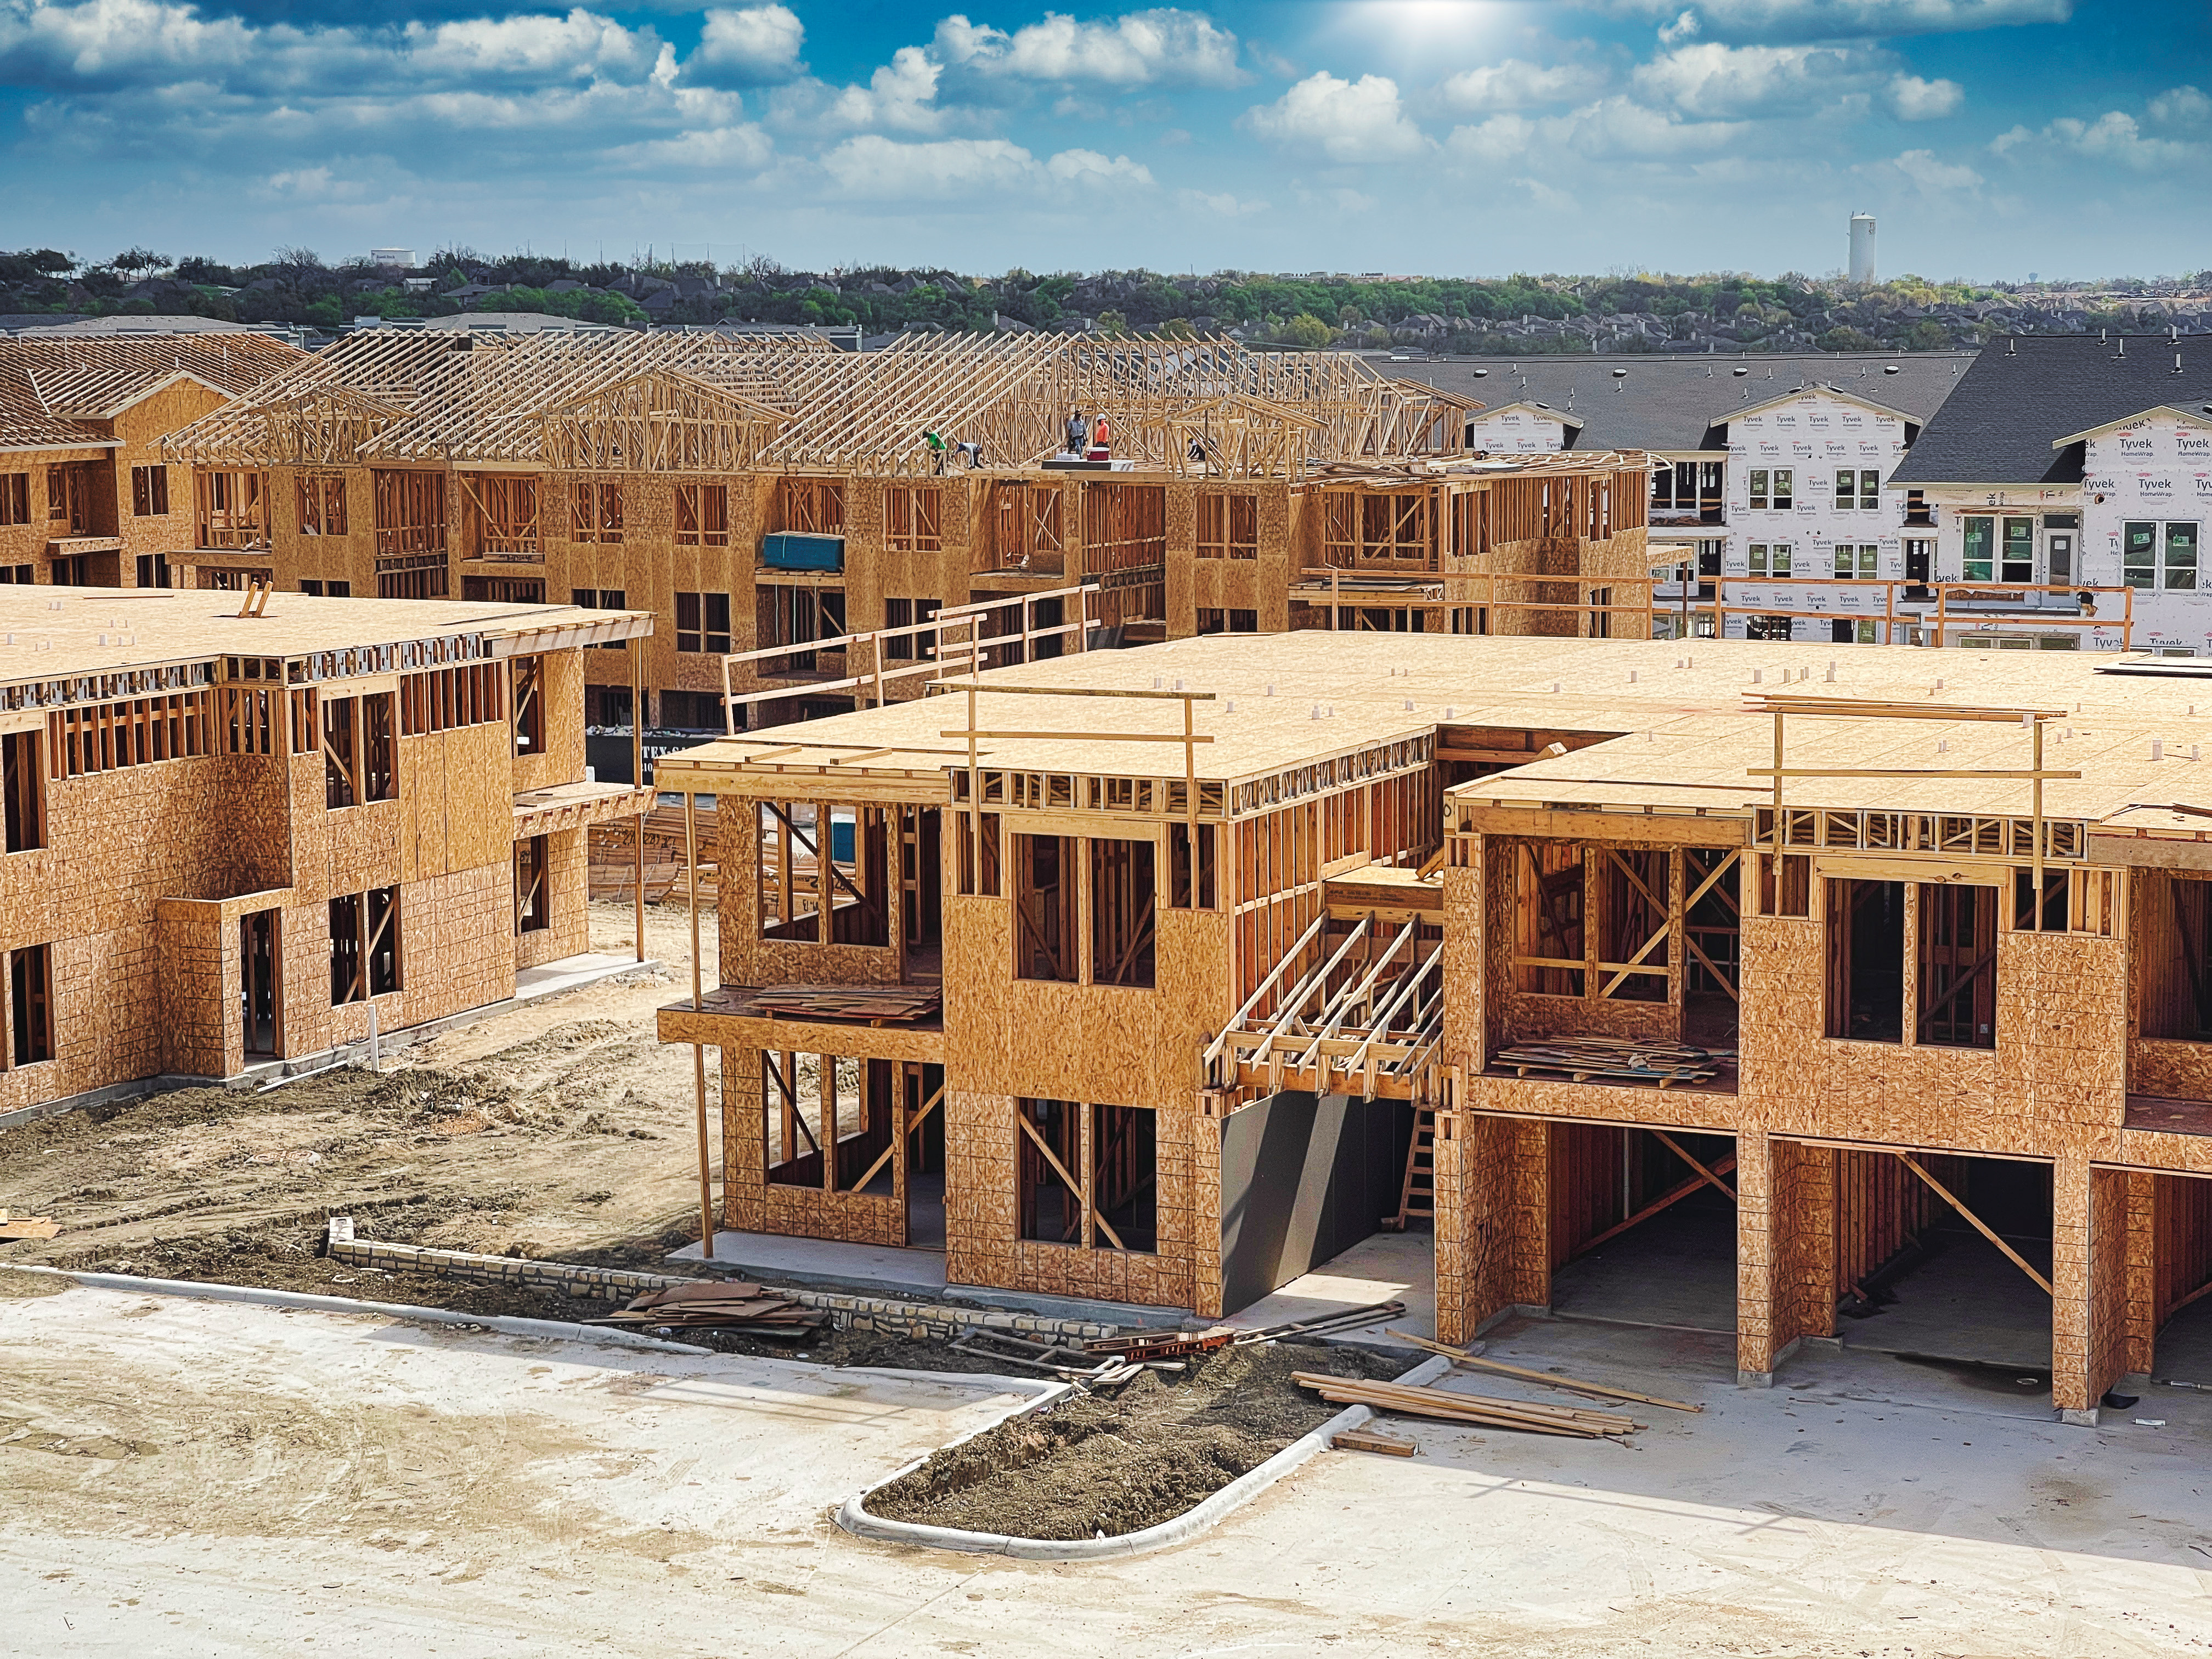
The Bureau of Economic Analysis released the real estate-related components of the government’s latest estimate for U.S. GDP growth early this week (after the full GDP estimates were released last week). The BEA reports that investment in both residential and commercial real estate—as a percentage of GDP—has been slowly recovering since the worst of the recession, but no category of real estate is yet at the rate of investment of previous decades.
Investment in single-family housing has crawled its way back above 1 percent of GDP after spending a number of years below that. From the 1960s to the 2000s, investment in single-family housing typically ranged between 2 percent and 2.5 percent of GDP, though it bubbled upward in the mid-2000s to nearly 3.5 percent, a rate unlikely to be seen again. Investment in multifamily housing used to be well over 1 percent of GDP, but tapered off below 0.5 percent by the 1990s, when public policy strongly emphasized single-family housing. Currently it’s roughly 0.25 percent of GDP.
As for commercial investment, office has recovered slightly to just over 0.2 percent of GDP, but that’s still a long way from the golden age of office development in the 1980s, when the property type nearly broke 0.9 percent of GDP. Investment in malls and hotels is still at about 0.1 percent of GDP each; those property types have been more stable across the decades, hovering between 0.1 percent and 0.2 percent since the 1960s.
CoreLogic sees upward momentum in home prices
CoreLogic reported on Tuesday that home prices nationwide, including distressed sales, increased 11.1 percent in March 2014 compared with the same month a year earlier. That makes 25 months of consecutive year-over-year increases in home prices. On a month-over-month basis, home prices—including distressed sales—were up 1.4 percent in March compared to February.
Excluding distressed sales, home prices nationally were up 9.5 percent in March compared with a year ago, and 0.9 percent month-over-month. CoreLogic includes both short sales and REOs as distressed transactions, and once upon a time (for a few years after 2008), they put a lot of downward pressure on all home prices. These days, their impact is muted.
“March data on new and existing home sales was weaker than expected and is a cause for concern as we enter the spring buying season,” Mark Fleming, chief economist for CoreLogic, notes. “Interest rate-disenfranchised potential sellers are adding to the existing shadow inventory, while buyers who can’t find what they want to buy are on the sidelines creating a new kind of ‘shadow demand.’ This supply-and-demand imbalance continues to drive home prices higher, even though transaction volumes are lower than expected.”
Trade deficit edges down
The U.S. Department of Commerce reported on Tuesday that in March the country experienced a trade deficit of $40.4 billion, down from $41.9 billion in February. March exports were $3.9 billion more than February exports of $190 billion, while March imports were $2.5 billion more than February imports of $231.8 billion.
It was selloff day on Wall Street on Tuesday, with the Dow Jones Industrial Average losing 129.53 points, or 0.78 percent. The S&P 500 was down 0.9 percent and the Nasdaq dropped 1.38 percent.