

Research Center

Tampa Multifamily Report – Summer 2019
Investors seeking higher acquisition yields than those across South Florida have pushed the metro’s sales volume above the $2 billion mark every year since 2015.

Detroit Multifamily Report – Summer 2019
The leisure and hospitality sector leads gains, mainly due to an increasing number of visitors as well as new hotel projects coming online.

Top 5 Markets for Multifamily Occupancy Growth
In contrast to national trends, the occupancy rates for the best-performing metros went up by as much as 160 basis points.

Dallas Multifamily Report – Summer 2019
The metro is one of the most sought-after markets in the country, with nearly $35 billion in apartments trading since the beginning of 2011.

Baltimore Multifamily Report – Summer 2019
Developers are moving forward with several multi-phase projects, including Howard Hughes’ Merriweather District in Columbia and Sagamore’s $5.5 billion Port Covington.

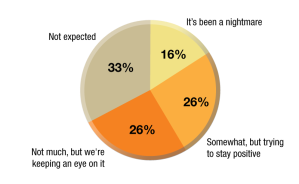
MHN Poll: Pressing Issues
MHN has a new poll! We want to know which pressing issue your company is focused on most.

Albuquerque Multifamily Report – Summer 2019
The metro is also poised to become a presence in the movie industry, due to major moves made by Netflix and NBCUniversal.

Tech-Driven Consumers Redefine Mixed-Use
Technology is accelerating the growth of new real estate models that straddle the lines between traditional asset classes. NMHC Vice President Sarah Yaussi weighs in on how the industry is embracing multiuse spaces.

Top 5 Markets for Multifamily Rent Growth
The country’s best-performing markets ranked by year-over-year rent increases through July 2019.